Anonymous confessions of workplace managers — the struggles of space planning

Over the years, we’ve asked more than 1,000 workplace managers not only how they count people in their space, but the challenges they’ve faced with their current solution.

We compiled some of the most interesting and common challenges below, in large part to help you realize you’re not alone. People counting is hard — even when you use certain technologies to simplify it.

Editor’s note: We’ve anonymized the stories — because privacy matters to us.

“Where is everybody?”

One night while closing, a library manager was startled to discover that his people-count platform counted 2,000 people in the building.

2,000?

The library never sees 2,000 people at one time, let alone at closing time. Where were these 2,000 people? The library was empty. You could hear a pin drop.

At the time, the library used camera-driven tech to know how many people came into the building (they’ve since switched to Density).

When the manager logged into his security camera system, he didn’t see 2,000 people milling around. He saw one stray dog running wild in and out of the library vestibule. The cameras couldn’t differentiate between humans and a dog. So, they counted the dog as a new visitor over and over again.

This wasn’t just an unexpected moment — it could have had disastrous implications.

Public libraries get funded by proving people count. They can face legal issues if they provide false data. If the manager hadn’t discovered the dog, he and his understaffed team might have had to invest countless hours months later to find out why one night they had a random spike in visitors.

“Big Brother is watching you.”

A couple of years ago, the head of facilities at one of the most recognizable tech companies on the planet bought desk-level sensors for her offices.

Yes, these sensors can help you understand how often people sit at specific workstations. But they’re not the most discreet devices.

That’s why the day after the company installed the desk sensors, employees ripped them out — they feared their employer was tracking them.

Funny? Yes. But it’s also indicative of a larger issue — the balance between privacy and data. Employers could use desk sensors to monitor the work habits of individual employees. This could negatively impact employee morale and workplace culture.

The question is, can employee privacy and people counting technology can coexist? We think so.

“Why does it have to be so complicated?”

How do you monitor the use of 1,000 conference rooms across the globe?

It was a combination of Google Calendar and a custom-built dashboard made during an internal hackathon for one iconic company.

But this custom solution delivered incomplete data in a dashboard virtually no one could use.

Google Calendar couldn’t tell them how many people actually attended a meeting. It only recorded that a meeting was booked for a specific time, with an X-number of people on the invitee list.

Ten people could have been invited to a meeting. But if no one showed up, Google still registered it as a 10-person meeting.

And the custom-built dashboard was so complicated that the workplace team couldn’t log in on their own. They had to ask an engineer to pull reports for them.

The custom-built dashboard was so complicated that the workplace team couldn’t log in on their own.

Two Python engineers spent their entire workdays maintaining the dashboard. A Python engineer’s average salary is more than $125,000 (1), meaning it cost this company around $300,000 every year to run an inefficient dashboard.

“Turn and face the strange ch-ch-changes.”

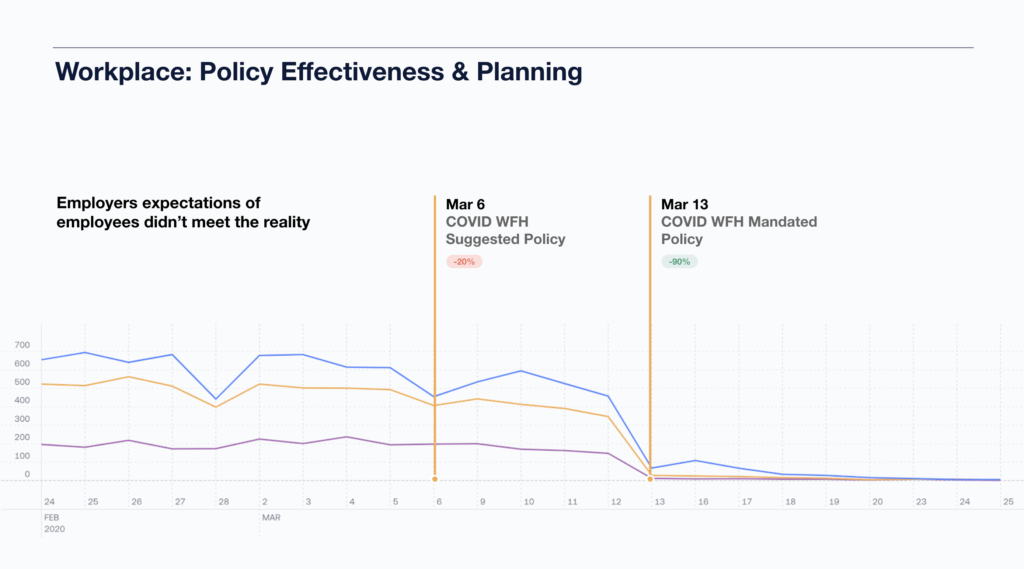
Many companies we’ve talked with over the past year had an office-first culture before the pandemic.

Now, it’s not so cut and dry. The CEO of one office-first tech company we talked with admitted his team is a lot more productive working from home than he would have once assumed.

This has him rethinking how his team uses and measures space. Before COVID-19, this company measured space using headcount and square-feet-per-employee. Now they’re left wondering if their only option for knowing how to manage space is to make educated guesses. (Spoiler: it’s not).

“I trusted you, loved you, and you betrayed me!”

A few companies we’ve talked with already use sensor technology for people count. But they felt they still needed to manually validate that data manually.

They had reason not to trust their sensor data (full disclosure, they weren’t using Density sensors at the time). One workplace manager said his sensors were triggered by a specific type of lighting. Another manager said that when a person walked by a glass office front, the office sensor thought a person entered the space.

These miscalculations create distrust, leaving companies no choice but to manually validate the data.

You shouldn’t have to do something twice. That’s not an effective way to run a company. At Density, we’re proud of the 98%+ accuracy of our Entry sensor.

“Badges? We don’t need no stinkin’ badges!”

Many companies we talk with use badge data to track occupancy, mostly because they already have badge systems in place. It’s convenient.

But, the data is also incomplete and a pain to access. A Fortune 500 company we now work with walked through all the ways badge data caused more headaches than helped.

For context, they (like most companies) only employed badge-in access at the front entrance. Employees didn’t have to badge-out to leave the building. They didn’t have to badge into or out of conference rooms, micro-kitchens, or soft-seating areas.

Whenever the workplace team wanted badge-swipe data, they had to go through their security team, who would scrub the data of personally identifiable information (PII) first. By the time the workplace team got the data, it was weeks or months in arrears and didn’t paint an accurate occupancy picture.

“It’s great to get badge-in data, but if it’s a salesperson going in for a Coke or quick meeting, it’s not really telling us how our space is used.” — Fortune 500 Workplace Manager.

It also didn’t help that the occupancy data of tens of millions of square feet were compiled into spreadsheets.

We know some folks love spreadsheets. But that’s a lot of tables to sift through.

“You’re not alone.”

It’s never been easy counting the number of people in your workspace throughout the day — let alone understanding how they use it.

It’s even harder now, when flexible work has become the new standard. Eight-hour work shifts and dedicated desks are a thing of the past. Employees come to the office a couple of days a week, for just a few hours of the day. When they’re in the office, they sit at a desk, reserve a conference room, and relax on soft-seating.

The pandemic shook the Etch A Sketch and we’re all starting over. New baselines need to be created.

But just because something’s hard doesn’t mean you shouldn’t do it. Real estate is your second highest line item on your P&L sheet. And in this new workplace, you probably have no idea how it’s used. The pandemic shook the Etch A Sketch and we’re all starting over. New baselines need to be created.

The good news is you’re not alone. Your colleagues around the globe face the same challenges you do — before, during, and after the pandemic. And tools like Density are making people counting and space analytics easier and more useful than ever before.

Are space utilization studies still valuable in the hybrid workplace era?

‍Companies pay hundreds of thousands of dollars to have people walk through their workspace with clipboards, documenting how their office space is used and measuring occupancy rates across their different types of spaces.

One Fortune 500 company we work with pays $750,000 every year to conduct quarterly studies at just one location — and they have nearly two dozen locations worldwide.

The result of this massive investment is a workspace study report like this one, used by corporate real estate execs for occupancy benchmarking which they then use to carve out their master plans and allocation strategies.

Visually, the report is impressive. And, there is value to these reports — they provide space planners with qualitative insights hard to acquire elsewhere (example: “Three individuals stayed in a conference room for approximately 15 minutes after a meeting had concluded to socialize and finish their coffee”).

But in the new, agile workplace, space usage data from these workplace studies can be inaccurate and outdated.

Workplaces can’t be measured in snapshots

Manual workplace studies (or bed checking) often take place over two weeks. Many believe this is long enough to create a space use benchmark that identifies peak and normal occupancy patterns. But two weeks isn’t long enough — certainly not in the new office.

The new workplace is not static.

The reason people come to your office is regularly changing. Teams that only use meeting rooms in July may want dedicated workstations in the fall. Employees currently excited to return to work to regain work/life separation may miss the comforts of home in a month.

The dynamic nature of the new workplace, including an uptick in hoteling, even impacts room use based on the time of day. Some team members may work from home in the morning, and come to the office later in the afternoon. This could skew utilization rates in a 2-week study.

“I think the days of being at a desk, and being at an office 8 hours are gone.” — Izzy Sanchez, Head of Global Workplace and Real Estate, Twitch

The new workplace is not static. Trying to capture trends and peak occupancy over just a few weeks in the new office is like trying to catch a teardrop in the ocean.

It’s wasted effort.

Data benefits from duration. The longer you can collect data, the more accurate that data is.

Manual studies are subjective

Manual studies rely on human observations. Humans literally walk through your workspace, counting the number of occupants and jotting down activities people are doing during the observation.

But what does occupied mean? Does a jacket on a desk mean that someone’s using that desk? Or could the owner of the jacket be at meetings for most of the day?

This micro-level accuracy matters as you decide if you need a new space or a newly designed current space.

Space utilization studies slow down decision making

It takes too long to go from question to decision with manual studies. You have to wait months to get the research findings to find out what space needs you have (if any).

The modern work environment is too agile for that. Three-month-old data is useless. Employees’ behavior patterns constantly shift for many reasons. You need to identify these shifts in real-time, and respond accordingly.

How you should measure space utilization

Space utilization data should always be available through a dashboard that updates automatically — in real time. This helps you make ongoing decisions in a continually evolving workplace.

The only way to know if you have enough space (or too much) is by measuring utilization over time.

Space utilization data should also measure at the building, floor, room, and desk level. Employees don’t live at their desks. Certainly not now. They float. They go to different floor levels, soft seating areas, conference rooms, and hallways. Badge access data and headcount-per-square-foot calculations no longer cut it for space planning (they never really did).

Years ago, manual studies were the most effective way to build context around badge data access. But manual studies are outdated. They no longer serve the modern workplace.

Continuous and real-time space analytics data is a more accurate metric for space management. This granularity of data empowers workplace and facilities management leaders to know how many people are doing what and where — at any given time, in any specific space.

COVID made the office a perk, not a requirement. How do you manage that?

The demand for space has changed.

COVID-19 forced people out of the office in the short term. But don’t expect to see full capacity anytime soon — if ever again.

Employees now dictate where work happens.

Some employees want to work from home. Others prefer the office. Most want to come to the office sometimes — but few want to sit at the same workstation all day.

Calculating 150-square-feet-per-employee is no longer useful in the new, dynamic workplace.

“We understand when people come in to the office, they’re coming in for a purpose, and we need to address those needs.” — Izzy Sanchez, Head of Global Workplace and Real Estate at Twitch

Our industry’s response has been to double down on the flexible workplace. Flexibility is a nice way of admitting ignorance. You have to be flexible when you don’t know what’s on the horizon.

No one is immune to this uncertainty.

Last year, Salesforce announced a 4-phase return to work policy. The fourth phase, once a vaccine was available, would bring all employees back to the office. They’ve since shifted gears. Now, two-thirds of employees will come to the office only one to three days per week (1).

“Gone are the days of a sea of desks,” Salesforce said in a release. “It no longer makes sense to expect employees to work an eight-hour shift (to) do their jobs successfully.”

Many of us might not want to admit it, but we’re relying on hunches and hopes to navigate the new workplace.

But your job doesn’t have to depend on guesswork.

Building a responsive workplace rooted in data

The new workplace needs to be agile, yes. But a better word is responsive. Responsiveness suggests an intention behind the agility.

The new workplace responds to its employees’ validated needs.

Validated is a crucial word choice. Asking employees what they want is not the same as validating what they need. This is why data is at the heart of the new workplace.

For example, you’re about to bring 30% of your workforce back into the office a few days a week. How do you manage that? What space configuration works best?

How do you maximize space without maximizing space?

Your employees will tell you by how they interact with your space. The challenge is determining how to observe this interaction.

The status quo tools we’ve used to manage and measure space are not up to today’s challenges.

Badge data doesn’t tell you how many people are in your space — or how they use it. Workplace studies are snapshots in time. But who’s to say data captured three months ago holds true today?

The new challenges in space management need unique solutions. The future of space management will rely on real-time, ongoing data.

The reality of the return to work

We talk about the return to work like it’s the final act of a yearlong play we’ve lived through.

It’s not. The return to work signifies a paradigm shift in space planning. We can no longer think in concrete, immovable ways.

The return to work signifies a paradigm shift in space planning.

Who’s to say 2022 isn’t the year of the office? And who knows what 2023 will bring. Maybe you’ll need more space. Maybe less. Maybe all you’ll need to do is reconfigure the space you already have.

You don’t know the answer — yet.

What is clear is in this first phase of return to work, don’t do anything. Don’t sign a lease, don’t shed space — not until you get people back into the office and measure how they use your space.

The urban exodus report — planning for the new workplace

Some reports claim the pandemic spawned a widespread urban exodus. If true, this would have significant implications for the future of the workplace.

Is there still a need for centralized and expensive downtown office buildings? Should companies open hubs in smaller cities or suburbs?

We analyzed and compiled data from Pew Research, Brookings, Zillow, Apartment List, and three national moving companies to determine if reports of the death of “the city” were greatly exaggerated.

What you’ll learn in this article:

  1. What role COVID-19 played in relocations in 2020
  2. Which city truly is on a concerning exodus track
  3. What was the primary reason people relocated during the pandemic
  4. Where people are moving to — and why

Highlights and key findings

  1. The freedom to work from anywhere inspired nearly 30% of COVID-related moves.
  2. NYC seems primed for an exodus. But Boston is the city seeing a mass migration.
  3. Four times more people moved into Boise in 2020 than left it.
  4. Most people are moving to other cities — not suburbs or the woods.

At least 20% of 2020 moves were due to the pandemic. Remote work made up 28% of those moves.

Roughly one in five Americans either moved because of COVID-19 or know someone who has.

28% of those who moved because of COVID did so because they could now work from anywhere.

Reasons for moving during the COVID pandemic.
Source: Density analysis of data released by HireAHelper.

Some data shows 70% more people moved out of NYC in 2020 than moved in. But that number is misleading.

northAmerican, United Van Lines, and HireAHelper all report that New York City experienced the largest outbound moves (roughly 70% more people moving out than moving in). But Apartment List data shows something different. 12% more New Yorkers searched for apartments within the city in Q2 2020 than in Q1, while out-of-city, out-of-metro, and out-of-state searches fell.

Note: Q1 was before the pandemic hit hard, particularly in New York City.

How NYC population was impacted by the pandemic.
Source: Density analysis of data released by Apartment List.

Why the discrepancy between the various studies? The temporary closure of college campuses could play a role. Students forced to leave campus would likely move back in with their parents. They wouldn’t have to search for apartments, but they would still need a moving company.

Another interesting statistic that could impact future commercial real estate decisions: Those who left NYC were less likely to move to a lower-density city in Q2. It seems even if you take the folks out of “The City,” you can’t take the city out of the folks.

But not every urban dweller was eager to stay in high-density areas …

13% of folks left Boston for a less dense city

When you think of potential sites for a mass exodus, you likely think of NYC, Los Angeles, and San Francisco. But Apartment List data shows Boston is on trend for a pending exodus.

20% fewer Bostonians searched for apartments within the city in Q2 2020 than in Q1 (San Francisco had zero change). Many people moving from Boston chose to go to a new metro area (including out of state).

Boston is experiencing an urban exodus.
Source: Density analysis of data released by Apartment List.

Both Boston and NYC are expensive to live in and experience harsh winters.

But Boston living is different from NYC living. More Bostonians than New Yorkers own a car. New York’s public transpiration system runs 24-hours a day. Some people would argue you could get everything you need in life — including worldly culture experiences — without ever leaving Manhattan.

That’s not the case with Boston. In other words, it’s easier for a Bostonian to consider relocating to a smaller city than a New Yorker. It’s less drastic a change.

And since more people can work from anywhere, it seems many Bostonians are choosing to make a change.

Money motivated most moves

We wanted to look beyond the cities to understand the motives behind moves in 2020.

There were some slight variances in the data we analyzed. But overall, Idaho, Arizona, Tennessee, South Carolina, North Carolina, Florida, and Texas enjoyed the country’s most inbound moves.

Warm weather is a commonality among some of these states, but the evidence didn’t suggest sunshine being the primary reason for relocation.

Money seemed the real common thread.

The map below, courtesy of Business Insider, illustrates the top income tax rate of every state:

The top income tax rate in every state.
Source: Business Insider.

States with little to no income tax rate (Texas, Florida, Tennessee, and Colorado) saw more people move in than move out in 2020.

California, New York, and New Jersey have among the highest income tax rates in the country. They also topped the list of most outbound moves of the surveys we analyzed.

While nice weather is a perk, it’s not a necessity. That explains Idaho.

Idaho is the fastest-growing state in the country.

Idaho has a 6.93 income tax rate and cold winters — yet it saw a significant population increase.

HireAHelper, United Van Lines, and northAmerican all cited Idaho as the top destination for movers in 2020. And while Idaho has seen a rise in population over the last several years, the pandemic inspired people to move there in droves.

In 2019, 49% more people moved to Idaho than moved out. In 2020, that figure was 103%, meaning twice as many people moved to Idaho than left it during the pandemic’s height.

Money and geography are the likely reasons why.

Despite its state income tax, the cost of living in Idaho is 7.8 percent lower than the national average. While it’s not the only state with a lower-than-average cost of living, it is among the least expensive Western states to live in.

Western states have, over recent years, seen more inbound moves than outbound moves. Only California has consistently ranked in northAmerican’s top 10 for outbound moves since 2015 (high cost of living combined with a lack of affordable housing in some cities is a reason for California’s bleak outlook).

Most Western states have seen a steady growth in population.

Idaho’s massive population increase since the pandemic is likely because the Gem State checks off most boxes. It’s a Western state, with plenty of space and a low cost of living.

It also has a large urban center (Boise) …

People are fleeing cities (for cities)

Neither Wyoming nor South Dakota has a state income tax. Each state’s cost of living is lower than the national average. And like Idaho, they have plenty of wide-open spaces.

Yet, they’re not experiencing the type of population growth as other similar regions.

It’s likely because of a lack of a major urban center.

For context, let’s revisit Idaho. HireAHelper data shows that four times more people moved into Boise in 2020 than left it. It’s safe to assume, then, that many people moving into Idaho aren’t living off the grid. They’re not even moving to the suburbs. They’re moving into a city with a population of 240,000+.

U.S. Census data analyzed by Brookings shows this type of domestic migration from major metro areas (metropolitan areas with populations exceeding one million) to smaller metro areas has been happening for several years.

U.S. Census data of people leaving larger cities for less dense areas.
Source: William H. Frey analysis of U.S. Census estimates, released March 26, 2019.

And while the chart above shows non-metropolitan areas seeing a population increase over the last several years, the pandemic has not inspired a monumental shift toward the suburban lifestyle.

Data compiled by Zillow in June 2020 shows search traffic for properties in suburban areas was slightly down compared to previous years. Apartment List data published in July 2020 found similar results. Nationwide, Apartment List data indicates a 1% increase in people looking to move into higher-density cities.

The takeaway: People have been leaving some cities long before COVID

Most major U.S. cities saw a boom in population growth in the first half of the 2000s. But over the last few years, they’ve seen a steady decline in growth.

This is a far more concerning trend than if an urban exodus was COVID-motivated. COVID-related moves could very well be temporary. Someone moves closer to their family, then grows tired of suburban life and moves back.

This steady decline from 2015 through the pandemic hints at something larger: cost of living and quality of life.

This is evident in the regional variation in migration trends (beyond just 2020).

The majority of moves that have taken place in 2020 and the years preceding it are to the South and West. While not every state with population increases (particularly in the West) touts the best weather or low cost of living, they offer something the Northeast does not — space.

Even before the pandemic, people appeared to grow tired of the congested roads, dense cities, and lack of open spaces in the east.

One long-term effect of the pandemic may be that an increased desire for space will move people away from dense, cold, and expensive cities like Boston and Chicago. The good news for businesses looking to establish a presence near top talent is that the evidence suggests people haven’t abandoned cities.

But there is a growing interest to relocate outside major metropolitan areas to cities that offer similar amenities with less density.

How and when will office workers go back to work after COVID-19?

The push to return to the office varies depending on which company you ask. Across the world, industry leaders are creating customized return-to-work plans based on their employee needs. Bank of America has adopted an office-only policy, while Microsoft and Google have taken to a hybrid approach.

Data gathered by CREtech expected nearly 60% of all employees to be back in the office by the end of Q1 2021. One year later, those results fell short as the pandemic continued to pick up steam, and employees demanded more flexibility in their workplace locale.

Workplace leaders are approaching the future of work with the understanding of prioritizing what employees need and what will drive them to come back to the office. Sure, offices may look differently. A shift to flexible and remote work will keep some people home — which aligns with a need for social distancing at the workplace. Still, millions upon millions of people will find themselves back in an office, at least a few days a week, in the not-so-distant future.

How do company leaders bring these employees back safely? 

We interviewed a number of our clients, ranging from tech companies to financial services organizations, to find out what they’re doing to craft their post-coronavirus return to work policy.

For context, our customers collectively manage over a billion square feet of space (35 sq. miles). Bringing their workers back safely and efficiently is (it’s almost needless to say) top of mind.

TL;DR: Companies are relying on occupancy sensors to maintain lower capacity levels, track employee compliance, and remain COVID-compliant.  

Promote social distancing with occupancy limits

It will take time to bring employees back into the office, full time. By imposing limits on the total number of employees allowed in the office, or on individual floors, our clients are protecting employees from potential contagious social interactions.

Using real-time occupancy data, they ensure that only so many people are populating specific sections of a floor, building, or campus. Over time, facilities teams will re-introduce more employees to the space and still keep tabs on where people are and how many people are there. This leads to a “phased approach” to returning, which avoids overcrowding and mitigates concerns about potential transmission. (More on phased approach below).

Take a phased approach to reopening your office

Having pre-COVID occupancy levels on day one is not realistic — or safe. We are no longer in a world where work expectations are driven from one location with a set schedule. For many, their home office has been their safe haven of comfort, deep work, and a flexible extension of their personal and professional lives. Your workplace leadership teams have an opportunity to safeguard employee health and experience, and to instill confidence that it’s indeed safe to return to work. 

Our clients see a phased approach as an effective strategy. It also reduces the burden already levied upon facilities crews who are working overtime to keep up with deep cleaning schedules. Additionally, a phased approach reduces the risk of the worst case scenario in which a contagious employee returns to the office and passes the illness to others.

Having pre-COVID occupancy levels on day one of your reopening is not realistic — or safe.

With occupancy data, our clients see exactly how the phases of a reentry program will change in the ensuing months. They can keep track of daily visits, team locations, occupied and/or vacant spaces, and pinpoint what areas of the offices need cleaning and what areas do not. By removing the guesswork, reliable occupancy data saves them time and money, and, importantly, assists in keeping people healthy.

Related readingUsing occupancy data to streamline cleaning services.

Stagger scheduling to maintain lower occupancy limits

Another way our clients use occupancy data to navigate their return to the office is by staggering employee schedules. Employers are considering assigning team shifts and alternate work hours. Much like the phased approach, schedule staggering limits the number of people allowed in a space at any given time. If companies can identify how many people are in different areas of a building/floor, they can create time-based allotments for office visits. This would reduce the risk of transmission between employees simply because they would occupy the same space at different times.

This can also benefit employees who take public transportation to work. If someone who usually arrives at 9:00 in the morning can actually take a noon train, they’ll avoid rush hour busyness during their commute, thus reducing the number of people in transit, as well as the potential for contagious interaction. If companies apply a staggered schedule strategy, they will also be able to direct essential staff and cleaning crews to targeted areas based on who has been where according to the agenda.

Related readingEntryway bottlenecks and risks to social distancing.

Create a cost-effective cleaning strategy

As a general rule, office space is cleaned on a schedule—and in many cases, the same number of staff hours are spent on a highly trafficked lobby as on conference rooms that have been used for a single meeting.

But the pandemic has changed the rules. Cleaning is more important now than ever before. And it’s incredibly costly.

Clients use Density’s sensor data to laser-focus their cleaning efforts according to how many people have used the space.

Using data to bring office workers back to work safely.
Density dashboard revealing which office floors need cleaning.

Density data has been especially helpful in places where people congregate in larger groups, such as cafeterias. Some teams with shared cafeterias have implemented “assigned” lunch periods to allow for greater space and the opportunity to clean surfaces between visits.

This approach has given facilities teams enough time to clean and sterilize popular gathering areas before the next wave of people come in to eat.

Occupancy data provides the real-time, actionable insight necessary to implement this type of use-based cleaning. Because our clients know how many people are in a certain place and when, they avoid wasting time cleaning areas that are not used.

Related readingOffice cafeteria safety in the COVID-19 workspace.

Use data to monitor compliance

First, some context: 

Early in the COVID-19 crisis, despite wanting to emphasize remote work, most companies in the United States only instituted “recommended” and “use your best judgement” policies. But leaning on Slack and Zoom for communication doesn’t mean your team is hunkered down at their home office.

The data we compiled found that early on in the pandemic, most employees continued to show up to the office.

The overall occupancy of real estate office buildings didn’t decrease as meaningfully as companies hoped — we experienced this within our own offices in San Francisco and New York. Because of this, many companies (including us) evolved our policies. We mandated stay-at-home orders.

Result: The number of employees coming to work fell nearly to zero.

when will office workers go back to work
Total occupancy report for a Density customer in late February and March

Remote working was no longer an option, it became a rule.

Aside from essential staff, no one has been allowed to come into the office, and our Density data certainly reflects that change. Occupancy numbers fell off a cliff on March 12th. The corporate employee exodus was in full swing — and we had data to prove it.

Our clients also use our sensor data to monitor employee compliance with ever-changing mandates. As a COVID-19 vaccine becomes widely distributed, companies will use Density occupancy data to monitor and enact reentry programs in a safe and strategic way.