Not everyone wants to live in a city (Fortune, 2020). COVID-19 showed us all just how possible it is to work from anywhere — even home.
But most employees don’t want to work from home (Gensler, 2020). They value spending time with colleagues. They just don’t want to sit through hour-long traffic to get to the city to do it.
Companies have to adapt.
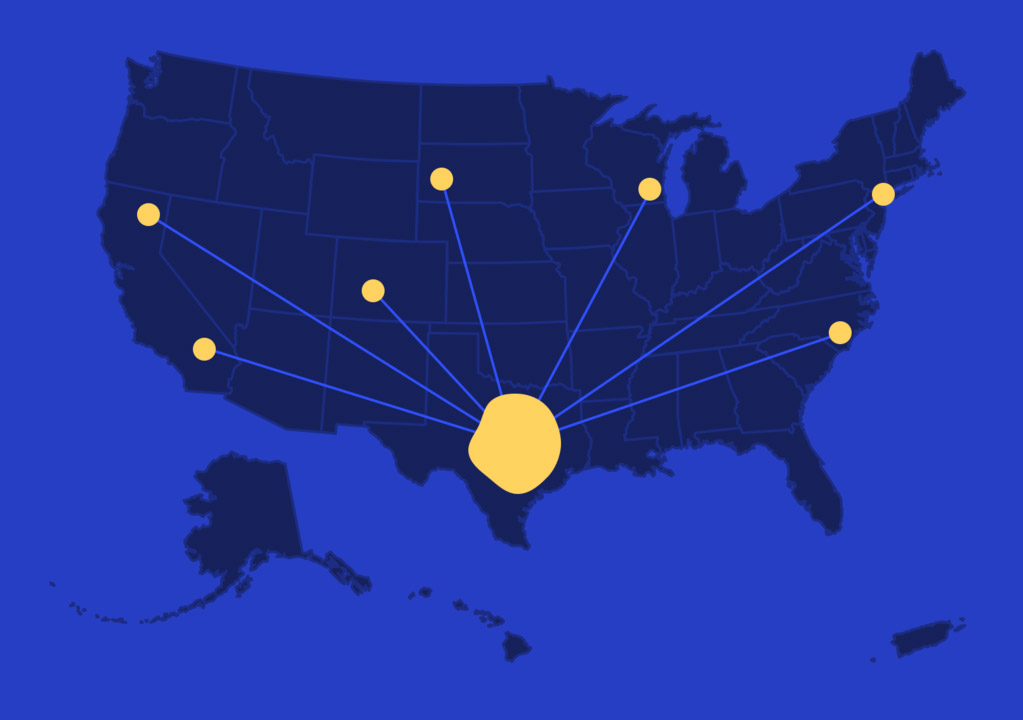
A hub-and-spoke workplace checks off most boxes. It lets employees work remotely and connect with colleagues when needed or required. It promotes a healthy work/life balance (less commute time) and brings companies closer to where the talent is — in suburbs, rather than dense urban areas.
Many companies were already headed this direction pre-COVID. The pandemic made it abundantly clear that to remain competitive in this new landscape, companies may need to increase the number of suburban regional locations (spokes) in their portfolio.
But for all the benefits of adding suburban spokes to your portfolio, there is one glaring challenge: space management.
Managing offices you rarely visit is hard. And each regional office you add to your portfolio compounds the challenges you face: How do you ensure your existing space is being efficiently used before you expand or move? How can you validate employees’ needs? How do you make objective recommendations regarding efficient space allocation
Managing offices you rarely visit is hard — but not impossible.
And those were just the challenges you faced before the pandemic. Since COVID-19, you have added concerns like maintaining lower-than-usual occupancy limits and social distancing guidelines.
Data is at the heart of all these challenges. The more you know how your space is used, the better decisions you can make about your space(s).
A singular look at all your spaces
We’re seeing more companies rely on sensor data to manage their regional suburban spaces from one central hub (they’re also using occupancy sensors to validate the need for additional spokes).
With Density, for example, you install sensors at each location. Our software then combines each sensor’s data to reveal metrics at the space, floor, building, and portfolio level in a singular dashboard.

This makes it easy to identify which spaces are most popular, which rooms are underused, and which teams use more space than they’re allotted.
Why occupancy sensors?
Sensor data is more complete and accurate than other methods, like badge data. With badge data, you have no idea what happens after someone hard badges into your regional office — not unless you’re there to watch them or you require employees to badge in to every space (neither are realistic).
And many companies that manage multiple locations deploy different badge systems for each building. This means separate data pulls to perform any analysis — an arduous task that often falls to the wayside.
You can’t depend on badge data to tell you the real-time occupancy of every space across your portfolio. As a result, you won’t know if the third floor of your satellite office is approaching capacity (important for the post-COVID workplace).
Occupancy sensors do show real-time occupancy levels. Density’s software does alert you if occupancy is approaching capacity. And, because sensors offer a more complete dataset, you can make better informed space planning decisions based on accurate historical usage.
And unlike video cameras, sensors can anonymously count people as they move through any entry point or open space. Neither our sensors nor our software captures any personally identifiable information (PII). This is what a Density sensor sees:

Our technology is anonymous by design, meaning you don’t have to compromise valuable workplace data to protect employee privacy.
The data these sensors provide help you make objective, non-political decisions on how to use, add, or shed space. Should you hold onto your existing lease? Should you transition to smaller spokes? Can you justify the push toward a hybrid model?
Occupancy sensors can tell you.
Below are example of how current clients who manage multiple regional locations use Density’s sensors and online dashboard to make smarter decisions about their spaces — no matter where those spaces are located.
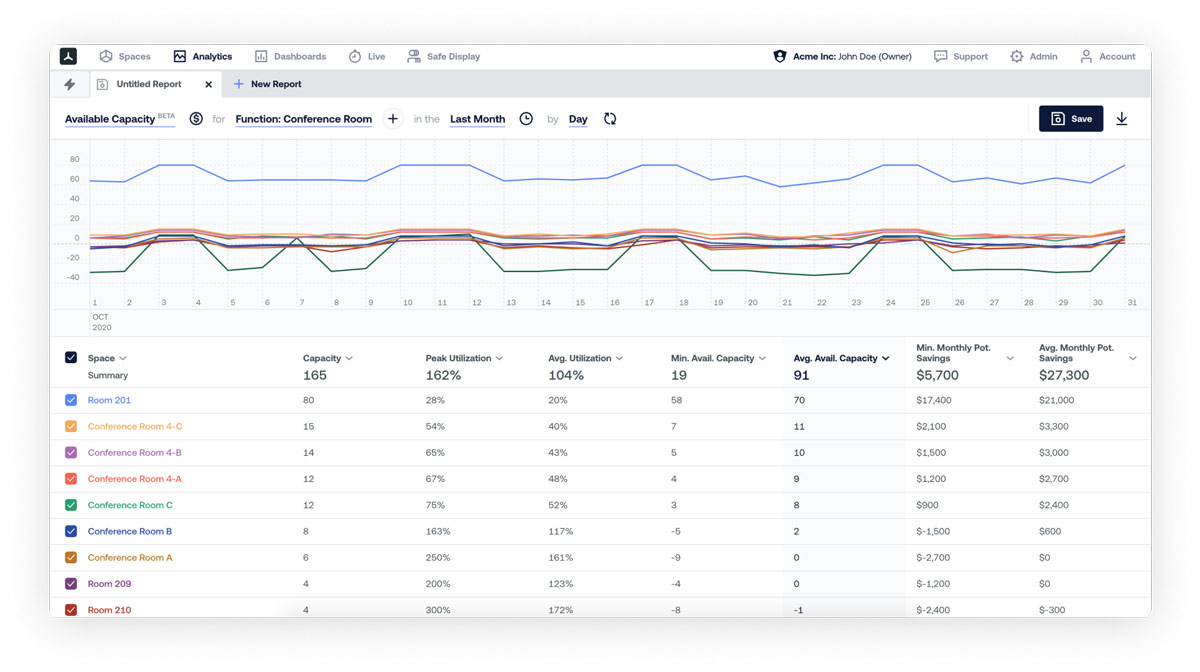
Identify waste
Take a look at the peak and average utilization percentage of each space. That way you avoid buying unnecessary square footage and instead understand how to spread employees and teams out more efficiently (both at the Neighborhood and Building levels).
You can also instantly see your potential savings if you were to eliminate unused space from your portfolio.
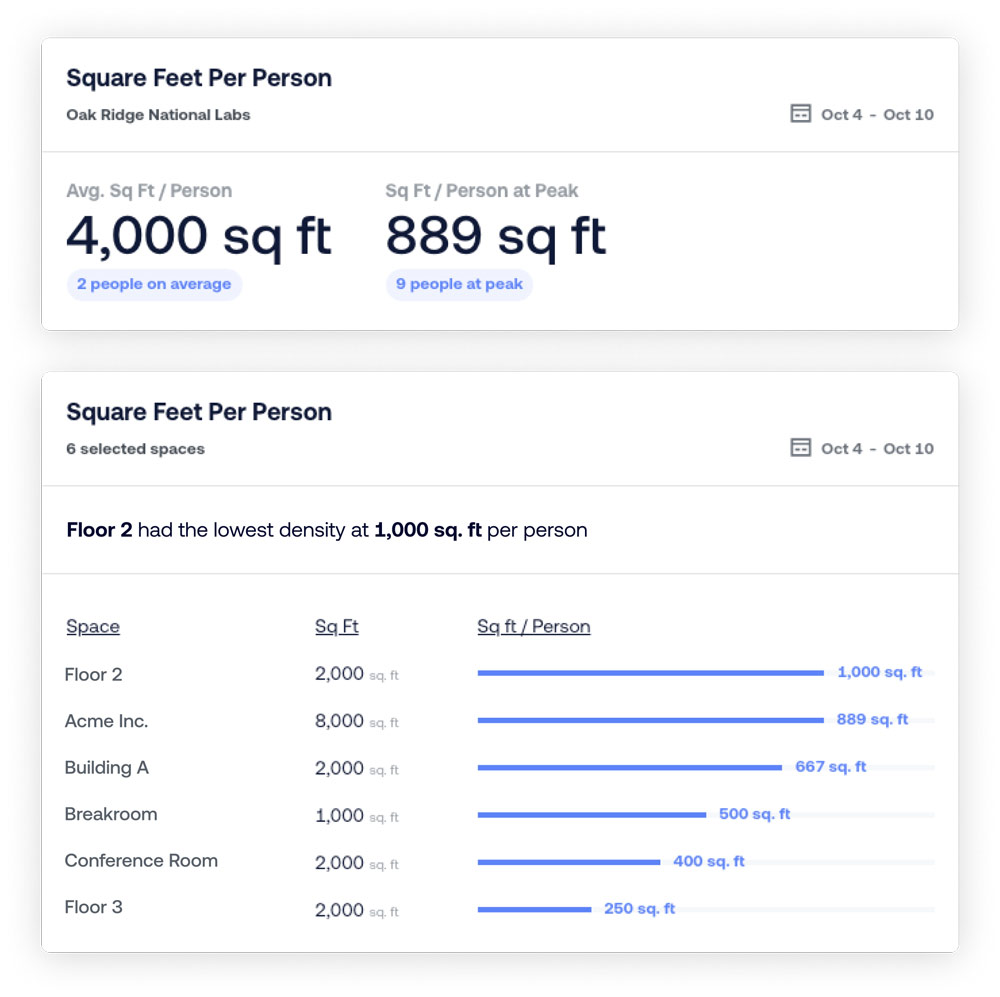
Measure square feet per person at a glance
See how well each space performs against your target capacity benchmark — including at peak density. Identify the buildings, floors, and spaces that have the lowest average density — so you can make informed space allotment decisions.
Quickly share all this critical reporting to key stakeholders for easy buy-in.
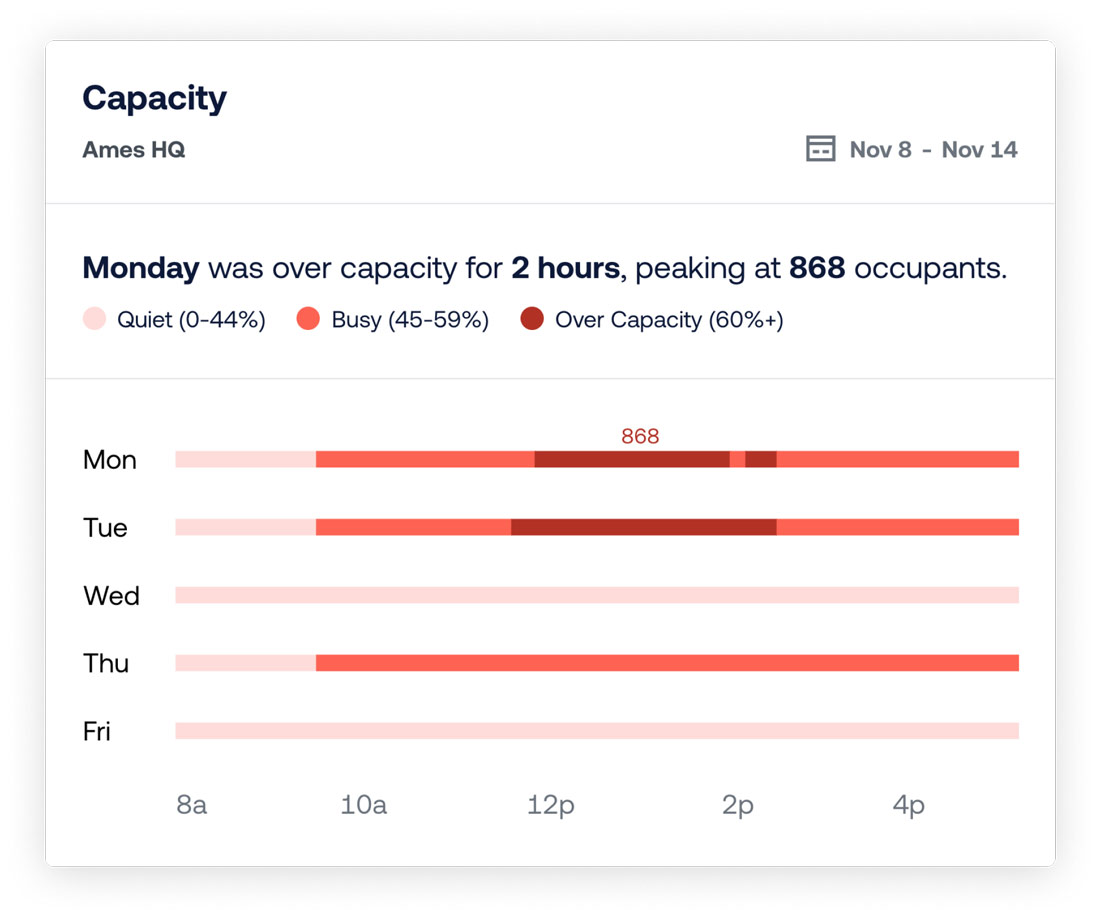
Create accurate baselines for future builds or improvements
See which days and times are quiet, busy, or over capacity across your portfolio. This data can be used to stagger schedules where necessary, move people around, or right-size you overall portfolio.
Many companies are looking to expand — or initialize — their hub-and-spoke workplace in response to the demand for flexible work. Sensor data can help you determine if this is your best option and, if so, what steps to take next.
As you add more locations to your portfolio, installing occupancy sensors across each location makes it easy to manage and maximize every space across your entire real estate portfolio.
