At Density, we’re focused on measuring three things in workplaces: buildings, spaces, and employee experience.
Since its launch this year, our Open Area sensor has created a novel dataset about the built world. It has inspired us to re-imagine what’s possible. Today, we’d like to introduce one of our newest features, Heatmaps.
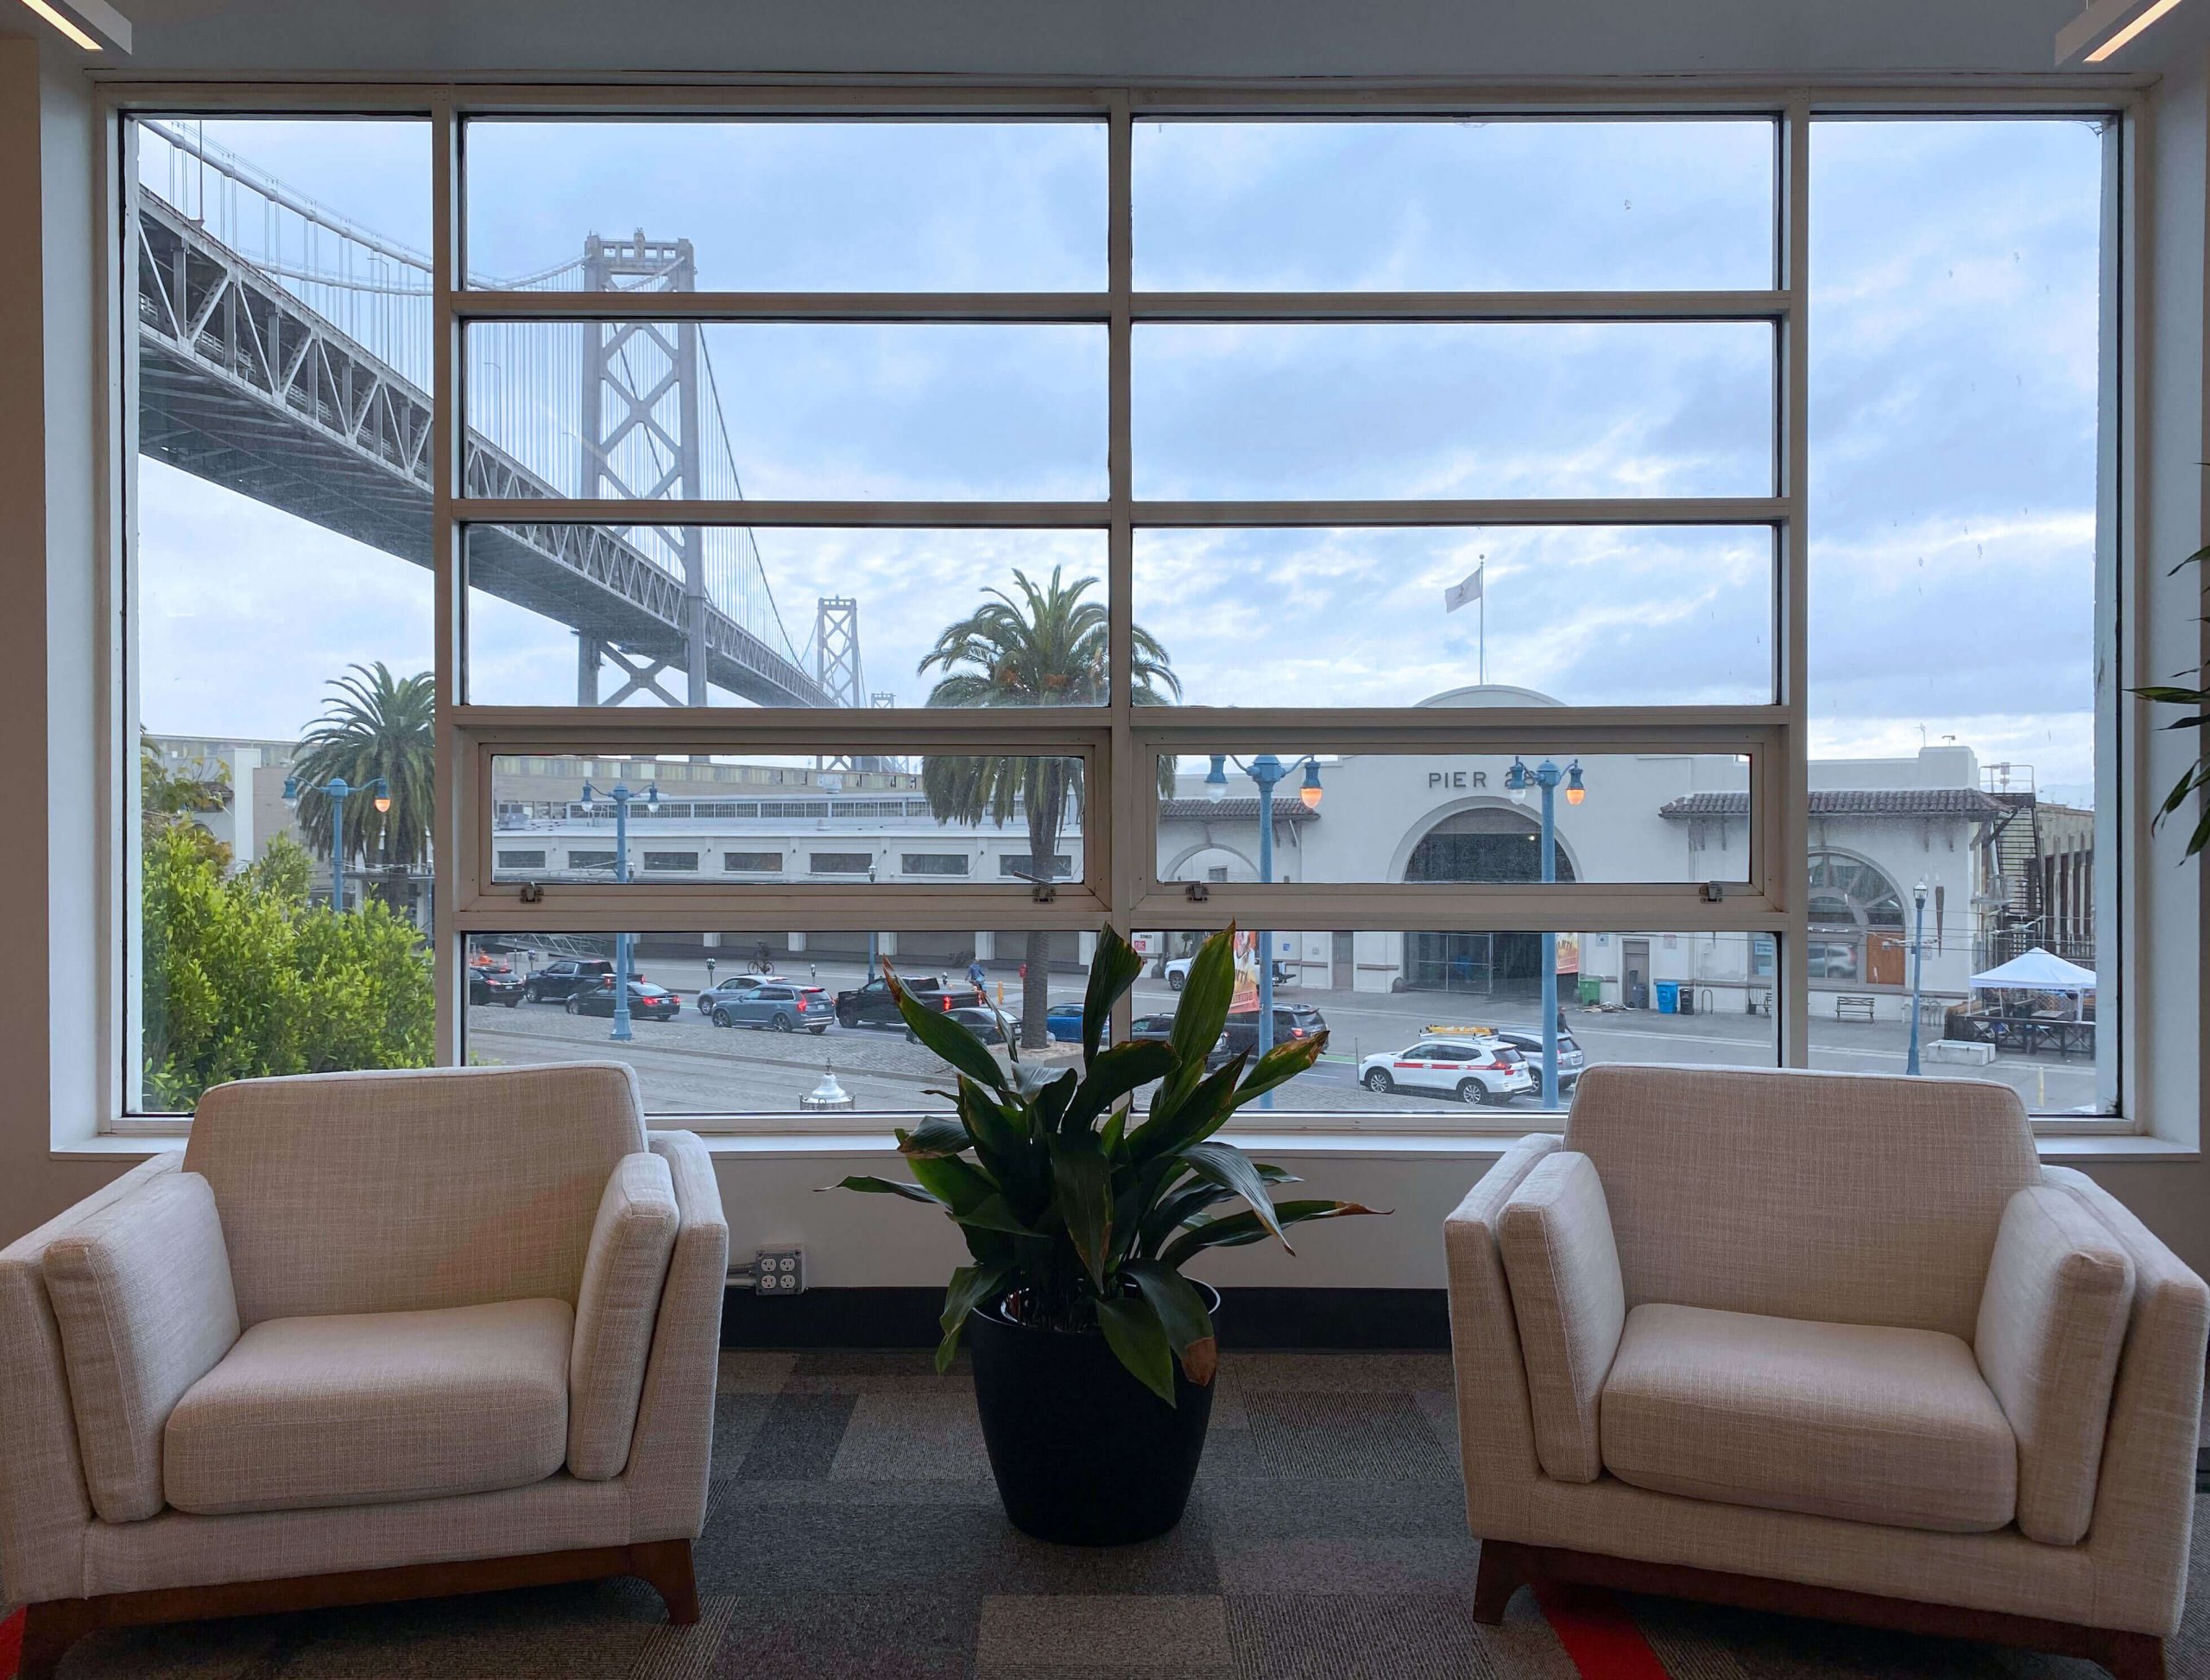
San Francisco — Bryant St
We recently moved into a new office in San Francisco. The space has a beautiful view of the bay. Naturally, its layout is a mix of conference rooms, workstations, phone booths, and common space. We have a hybrid model where all of our spaces are unassigned.
Density’s newest feature, Heatmaps, is unearthing the story behind our space — how we vote with our feet and where we linger, collide, wander, and focus.
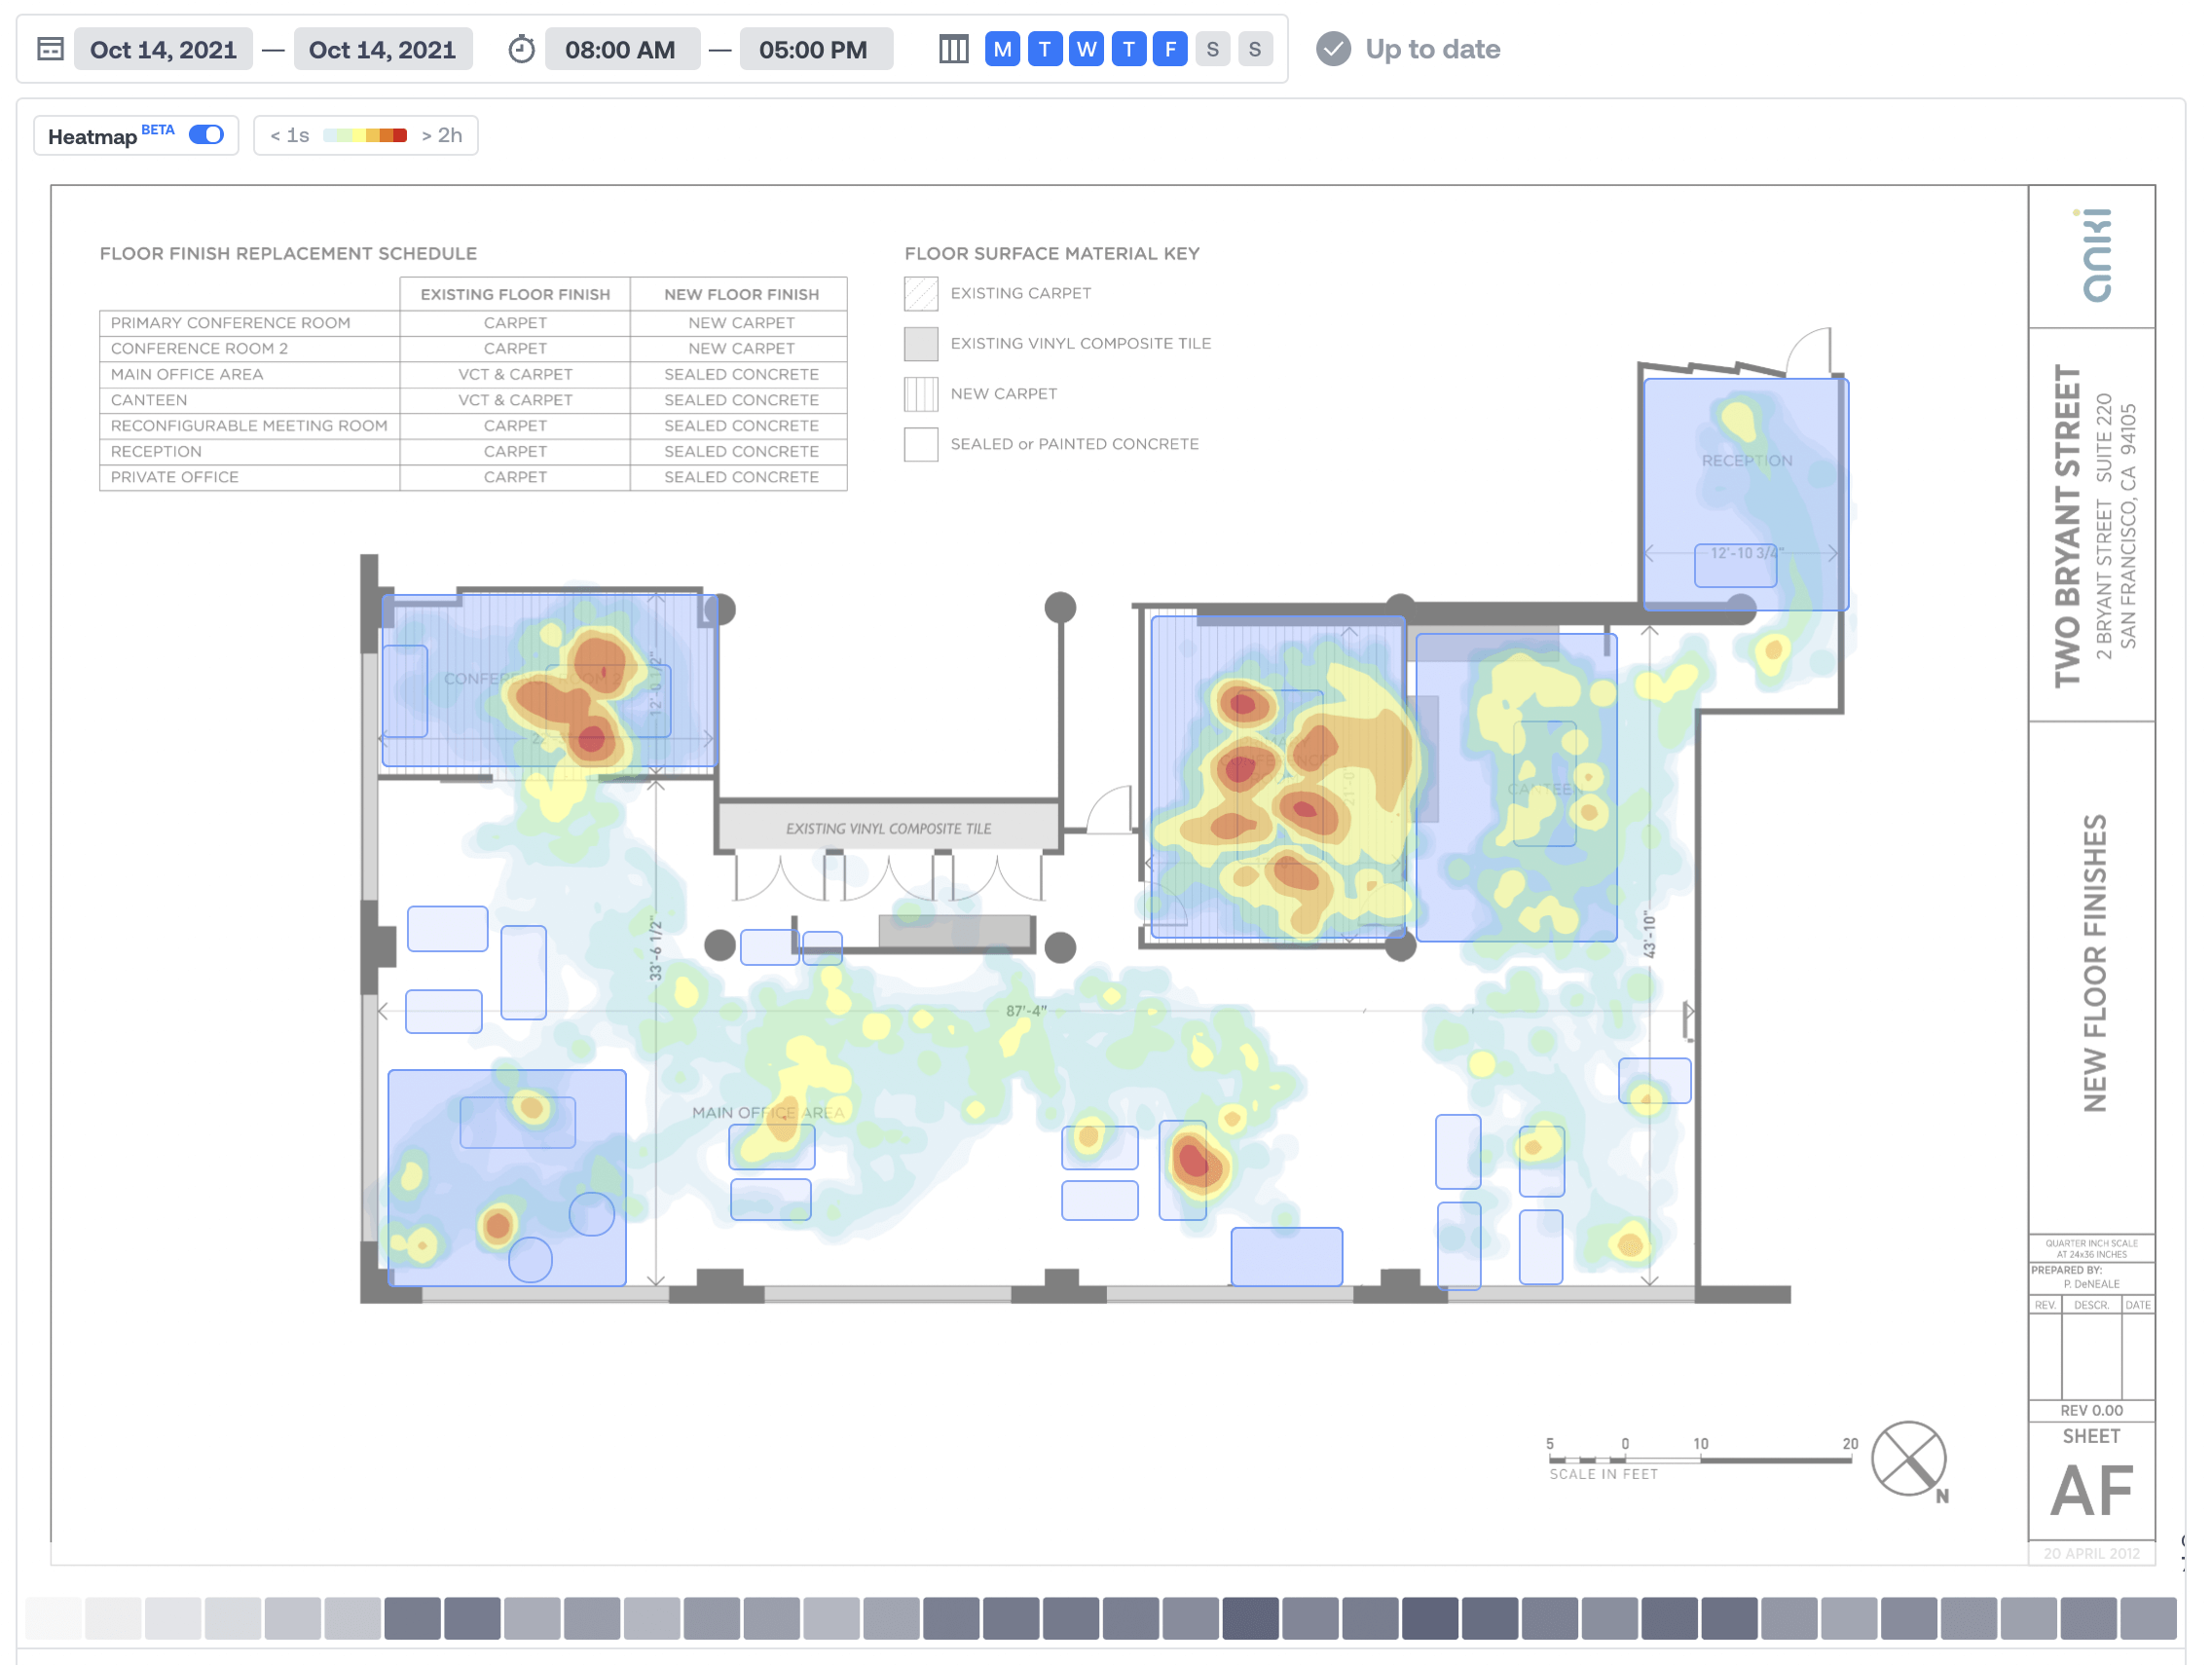
On October 14th, 2021, a product team had a full day offsite. Most of their day was in a large, central conference room.
Unintentional Behavior
Let’s zoom in and scan back and forth over the lunch period. We’re using Heatmaps’ native timeline function. It’s obvious this room was used for more than just meeting. From the data below, we can infer that they worked through lunch. Likely eating at the conference room table. How a team uses a space can’t be incorrect but it may be unintentional. What could have been done to improve their experience?
The Northwest Wall
Before jumping to a solution, let’s look at the rest of the day. Open Area and Heatmaps are anonymous at source. We’ve made it impossible to determine who a person is. However, Density generates remarkably precise data about movement.
In our team’s offsite story, they keep lingering near the northwest wall. Why? Well, they’re using a whiteboard. Is there anything else we can learn before we conclude?
Ripple Effects
It’s useful to think about physical space as an organism. Everything as interconnected. Behavior in one part of a floor affects behavior elsewhere. Now, we can measure the ripple effects. When our offsite team booked the large conference room for the day, the rest of the floor migrated to the remaining available spaces for work.
The small conference room (top-left) was used for 5 hours and the only desk occupied for a meaningful part of the day was Desk 6 (bottom-right). It was used for 6 hours. Kitchen, phone booths, and common areas has sporadic use. Meetings were the primary function of the day.
Zooming Out
If we look at aggregate utilization over the week, it’s clear the offsite was held over two days, most individual spaces were used less than an hour per day, and dedicated collaboration space (conference rooms) were in high demand.
Heatmaps can help us look for patterns. In the near future, Density will begin proactively drawing connections between similar spaces to make this type of discovery turnkey.
Conclusions
The offsite team would probably be more productive in a larger, multi-purpose space. One that supports the type of work they’re trying to do. One that supports long duration seating, a separate area for food and drink throughout the day, and a central place for whiteboarding, presentations, and debate.
The best part is that we’d get to see how this changed behavior.
Feature Availability
Heatmaps is available now for all Density customers who have deployed Open Area. Learn more about heatmaps here. You can schedule a live demo here.
Personal note
Turns out I like to pace when I take calls.
— Andrew Farah, Density CEO