Leverage Workplace Square Footage / Person Metrics to Manage Social Distancing

In the midst of the current COVID19 pandemic, the workplace management teams are focused on a singular question: How can I use my people-count data to plan for the health and safety of my colleagues when they return to work?

These teams have shifted from thinking about maximizing office space utilization for cost efficiency, to decreasing office density for social-distancing.  Their new goal is to maintain square footage/per person above minimum thresholds in order to give employees more space.

Use Historical Sq Ft/Person Devise and Test Your COVID19 Response

“What gets measured, gets managed.”  Sq ft/person is a clear metric that can help workplace teams set, and monitor against, specific targets to help de-densify their office spaces.

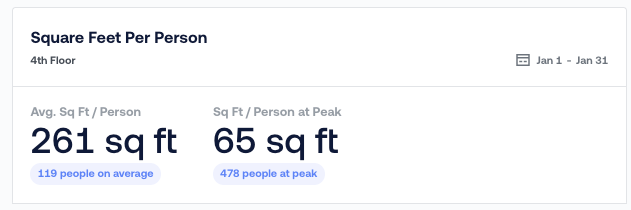
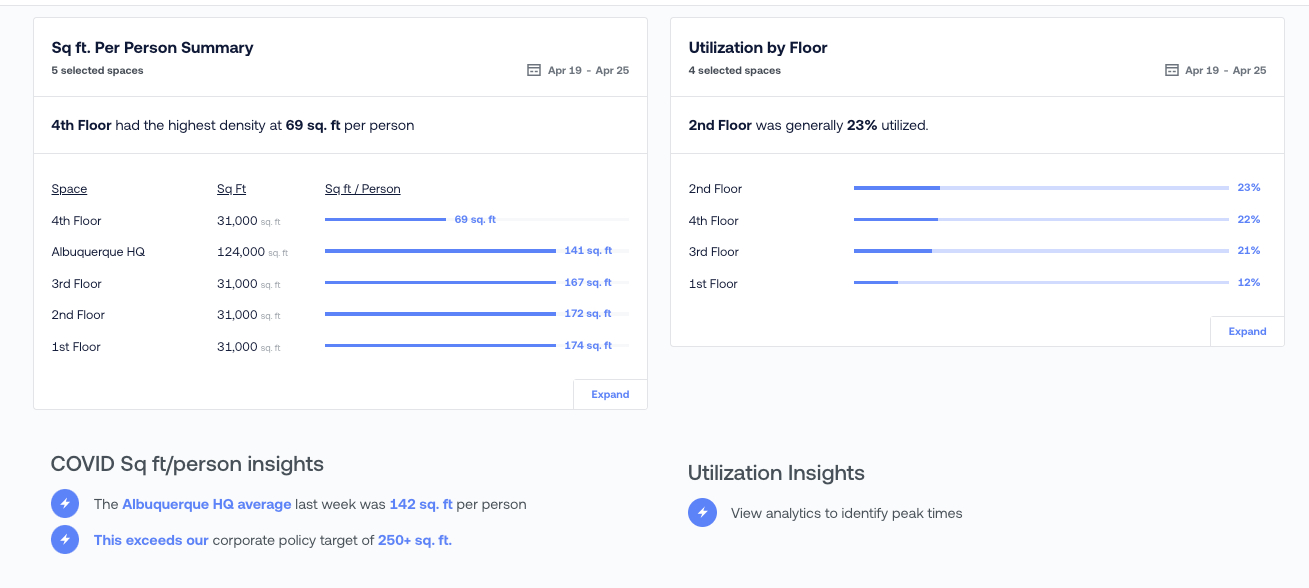
The 4th floor in the example above indicates an actual measured density of  261 sq ft/person on average, and 65 sq ft/person at peak.  Equipped with this data and a knowledge of the particular floor’s layout, a workplace manager may decide to target a minimum density of 300 sq ft/person on average and 150 sq ft/person at peak in order to make it easier for employees to social distance.

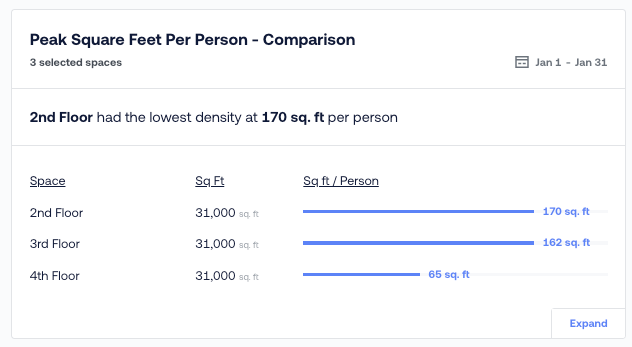
With these objective targets in mind, the workplace team is now equipped to structure and test different strategies to de-densify the 4th floor.  For example, seeing that the 2nd floor is significantly underutilized compared to the 4th floor may provide an opportunity to reassign teams from floor 4 to 2.  Alternatively the team might try other options such as implementing staggered in-office schedules, or a phase-based return-to-office plan.

Most importantly, the data above will provide continuous feedback on how the workplace team is performing against its goals. Communicating this data directly to employees will help build credibility and the peace of mind that the workplace team is focused on employees’ health and safety.

Apply This Approach Across Different Types of Spaces   

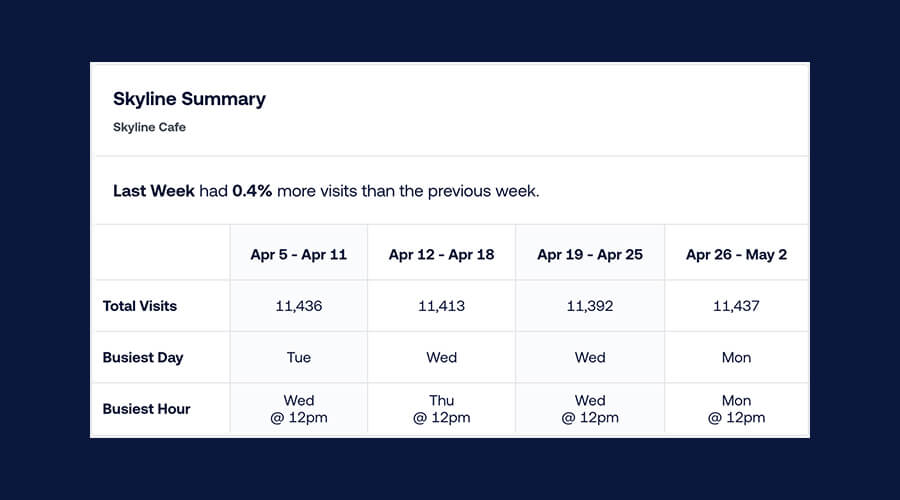
This approach is not just helpful for office floors.  One can leverage sq ft/person at the building-level, or in general-use spaces (e.g. cafeterias to help inform and test COVID-19 response strategies.

Building-Level Sq Ft / Person

Set up building-level sq ft/person reporting with as few as 5-10 people-count sensors (i.e. enough to cover all ground-level building entrances).  These sensors will count all the individuals who enter and exit your building – including badge employees and one-time visitors.  Additionally, these people-count sensors can alert security teams when tailgating occurs and provide sq ft/person metrics that are more complete and robust than simply using badge data.   

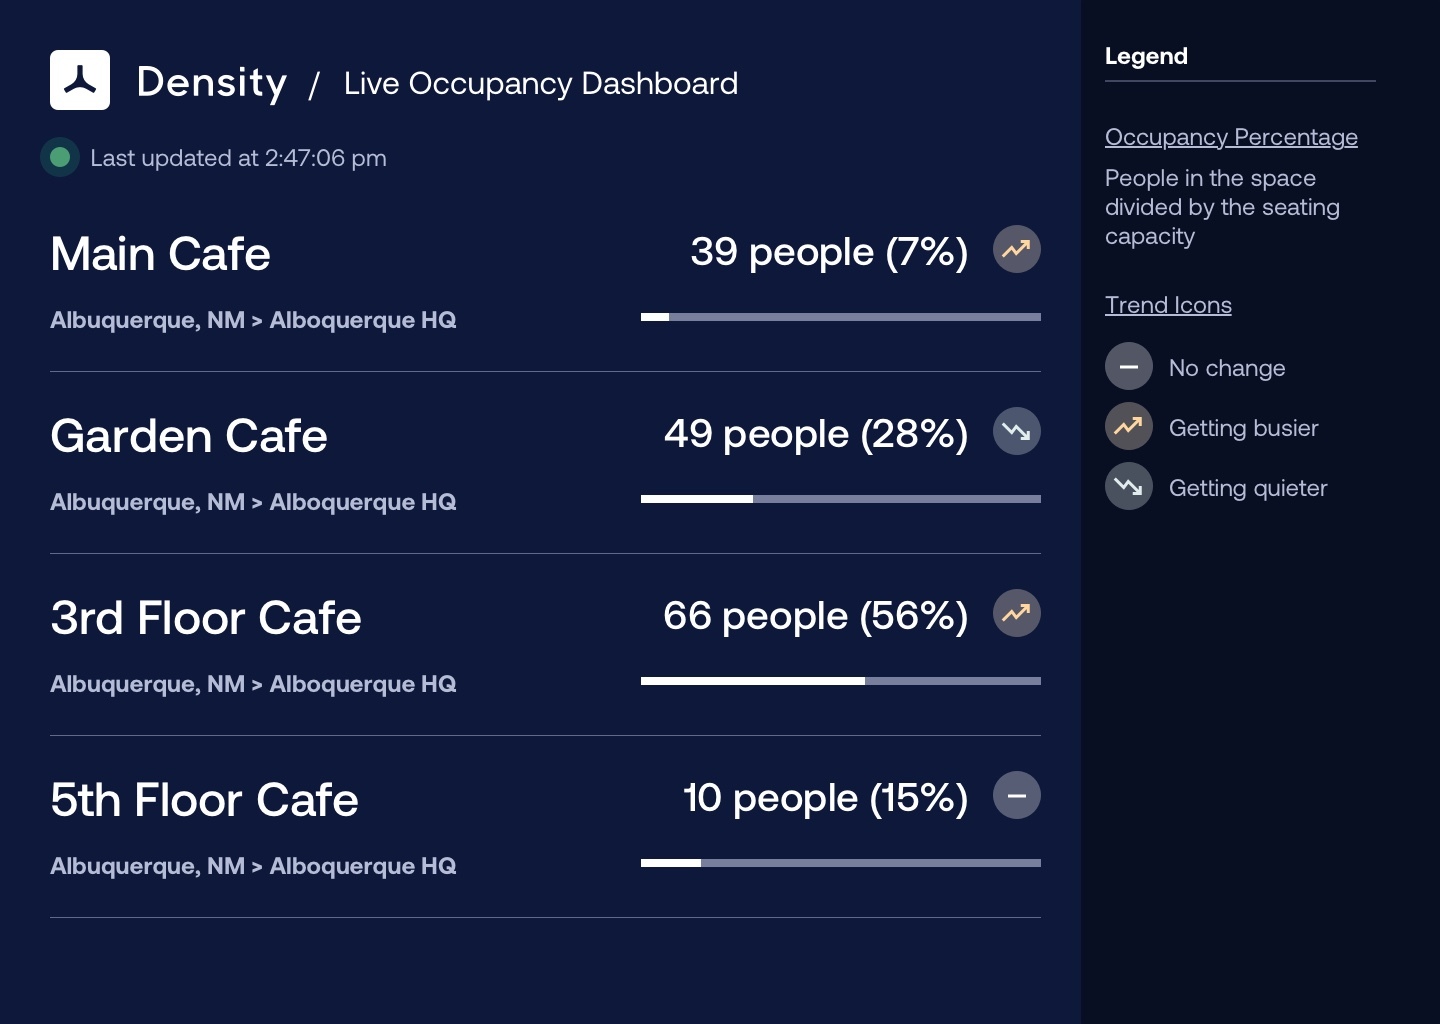
With these sensors in place, you can get a comprehensive, comparative view of your building and floor-level density metrics:

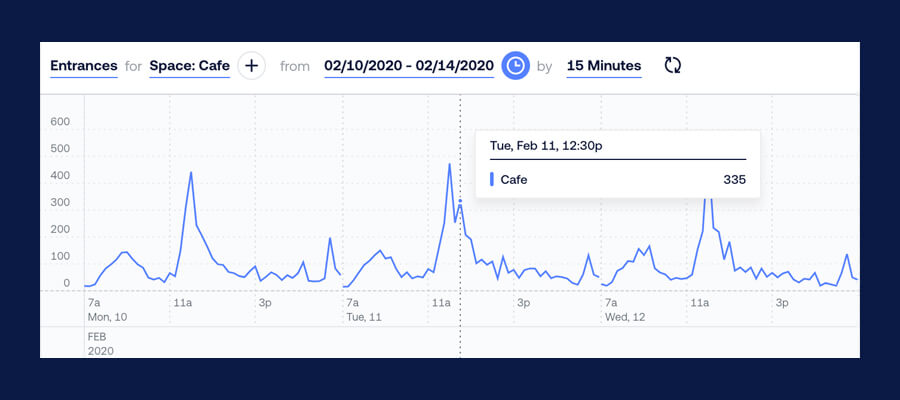
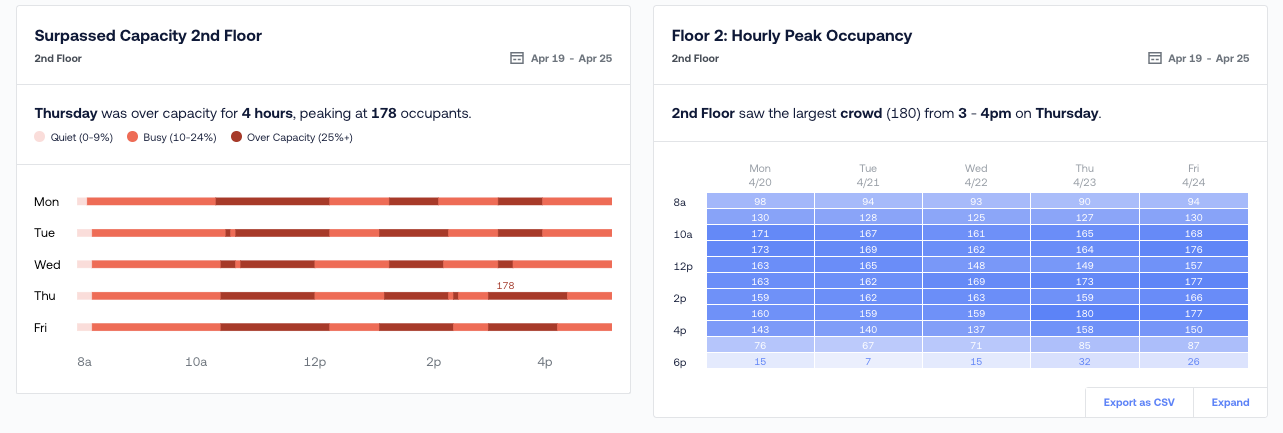
And go deeper on particular times and spaces of interest:

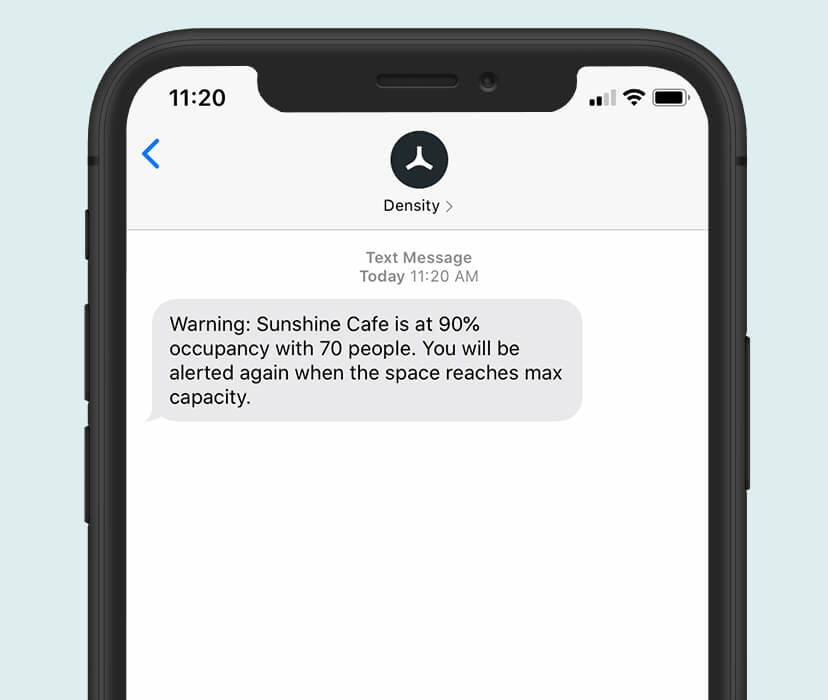
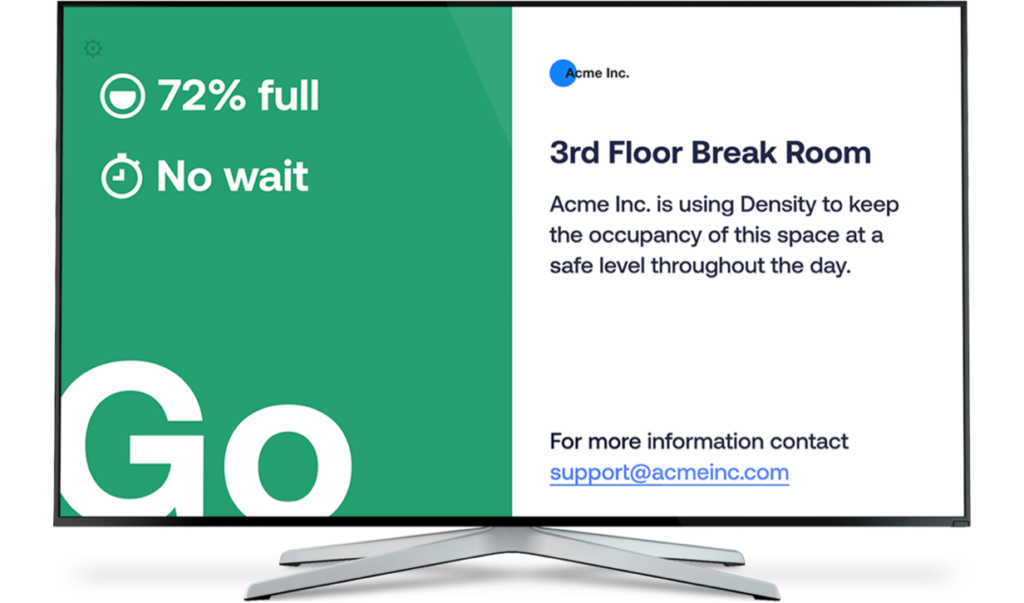
De-densifying general-use spaces will require maintaining occupancy caps relative to available space.  With this in mind, Density is soon to release Live Digital Displays which will display real-time Sq Ft/Person, and a Go/No-Go signal to the next person who wants to enter.  This will help grocery stores, restaurants, cafeterias, and other public-use space limit occupancy in the interest of social distancing.   

Uncertainty is the hallmark of this COVID19 pandemic.  No one has all the answers about when or how to most safely return employees back to the office.  Objective, quantitative data such as sq ft/person metrics provide a foundation from which organizations can devise and test different strategies. 

In the face of the COVID-19 pandemic, Density is singularly focused on helping its users prioritize health and safety in their spaces. Sharing ideas and best practices is invaluable.

We’d love to hear from you.

How is your organization planning for return-to-work in a post-COVID world? How are you making these decisions?

Contact us at cs@density.io.

Safe Return to Lunch

In the wake of the COVID-19 pandemic, organizations are prioritizing health and safety at onsite cafeterias. Density customers are considering a number of options, including serving boxed lunches, increasing food-service staff to eliminate self-serve models, splitting employees across specific meal times with cleaning in between, and possibly eliminating breakfast and dinner service. 

Mealtimes contribute to employee satisfaction, productivity, and creativity. While implemented approaches will differ, workplace and facilities teams are looking for ways to preserve mealtime while keeping employees safe and healthy. 

As a Density customer, you can use your visits and occupancy data to:

  • Devise your back-to-work foodservice strategy
  • Adjust your strategy in real-time based on data
  • Build credibility and buy-in with employees

Devise your back-to-work foodservice strategy

By analyzing historical people-count data, workplace teams can discover employee behavior patterns to inform new policies.

Use Density to know when your cafe(s) was the busiest via the Analytics module. With Analytics, you can isolate your pre-COVID breakfast, lunch, and dinner service times to identify trends.

Density dashboard showing entrances to a cafe at 15 minute intervals

In the example above, you notice an interesting correlation between breakfast and lunch:

  • On Monday and Friday where breakfast entrances spike earlier in the morning, there is a singular large surge in entrances at 12 PM for lunch, indicating a higher likelihood of people clustering
  • On Tuesday, Wednesday, and Thursday their entrances for breakfast spike later in the morning and you instead see two smaller surges for lunch, spreading entrances more evenly across the lunch service

Although we know that correlation doesn’t equal causation, this data suggests that when a majority of employees eat in the late morning, their visits for lunch are more evenly spread out through the meal service. These types of signals can be helpful to inform your initial mealtime service strategy. A combination of extending breakfast and lunch service hours, partnered with employee education about reducing the lunch rush may be sufficient to ease entrance volume. In more extreme cases, you may want to consider reducing the number of employees that enter the Cafe at 12 PM and flatten the curve of entrances over the lunch period so that people come at more varied times.

Adjust your strategy in real-time based on data

Historical Data is a great tool to inform policy, but you’ll need data to assess efficacy and adjust strategies in real-time once employees return to the office.

To quickly respond to spaces with distancing risks, you can set up mobile alerts to be notified whenever any of your eating areas or Cafes reach or exceed the safe capacity threshold you identified. 

Density also enables you to quickly spot spikes in entrances or occupancy work via the Analytics module. Knowing when and where the high-traffic areas are can support focused efforts to flatten the curve. As you adjust your policies, you can use the same tool to show how effectively you’re smoothing that curve over time.

Historically, some of our customers use a “10 AM signal” to forecast the busyness of the Cafe. After reviewing their data, they see there is a strong correlation between the occupancy of their office by 10 AM and the spike of entrances they will see in their Cafe for lunch. As they bring employees back to the office, they hope to continue to use the Density data to find similar indicators so their Facilities Ops and Cleaning teams have a better sense of how busy the Cafe will be during lunch.

You can also use Density data for executive summaries and other external reporting for individual cafes, or as a single pane of glass across your global portfolio. Density offers one-time or recurring email digests as a feature to share your people-count data more broadly as another tool to quickly assess the effectiveness of policies or programs.

Build credibility and buy-in with your employees

Clearly communicating context and importance of changes the workplace team is making on behalf of employees is critical to get buy-in. Access to real-time data enables employees to exercise more control over their own health and safety, including decisions like:

  • Where and when to eat
  • When to queue

Where and when to eat

Using Density’s Live View Dashboard, employees have easy access to real-time occupancy data and utilization of cafes. With this information, employees can identify which cafes are getting busier or quieter at a glance and make an informed decision about when and where to go for lunch.

Access to real-time data also takes pressure off of workplace and facilities teams as employees have the necessary tools to self regulate. 

When to queue

In addition to Density Live, some customers customize digital signage to post outside their cafe and key places around the office to provide visual cues to their employees when it is safe to enter the space. 

At default, the status board will show how many people are in the cafe and how close it is to being full to inform the employee if it is safe to enter or if they should continue to wait outside until someone else has left. The recommendation is based on the target square footage per employee your team has set as its threshold. We’re actively partnering with customers to customize status boards for their unique parameters, let us know if you’d like to discuss a custom solution for your organization.

Whatever measures your company takes to keep employees safe and healthy as we all adjust back to the office, employee perception will be paramount. Empowering employees with data they can use to make the best decisions for themselves and their teams will help to expedite the process of feeling safe in their workplace again and build support and credibility around safety initiatives.

In this unprecedented time, our highest priority is people’s health and safety. Sharing ideas and best practices is how we’ll all return to work in the safest way possible.


We’d love to hear from you!

How is your organization evolving your approach and policies in a post-COVID world? 

What inputs are you using to make these types of decisions? 

Contact us at cs@density.io or tweet us @densityio.