Designing Inclusive Workplaces With Tech: A Conversation With Nellie Hayat and Darren Graver

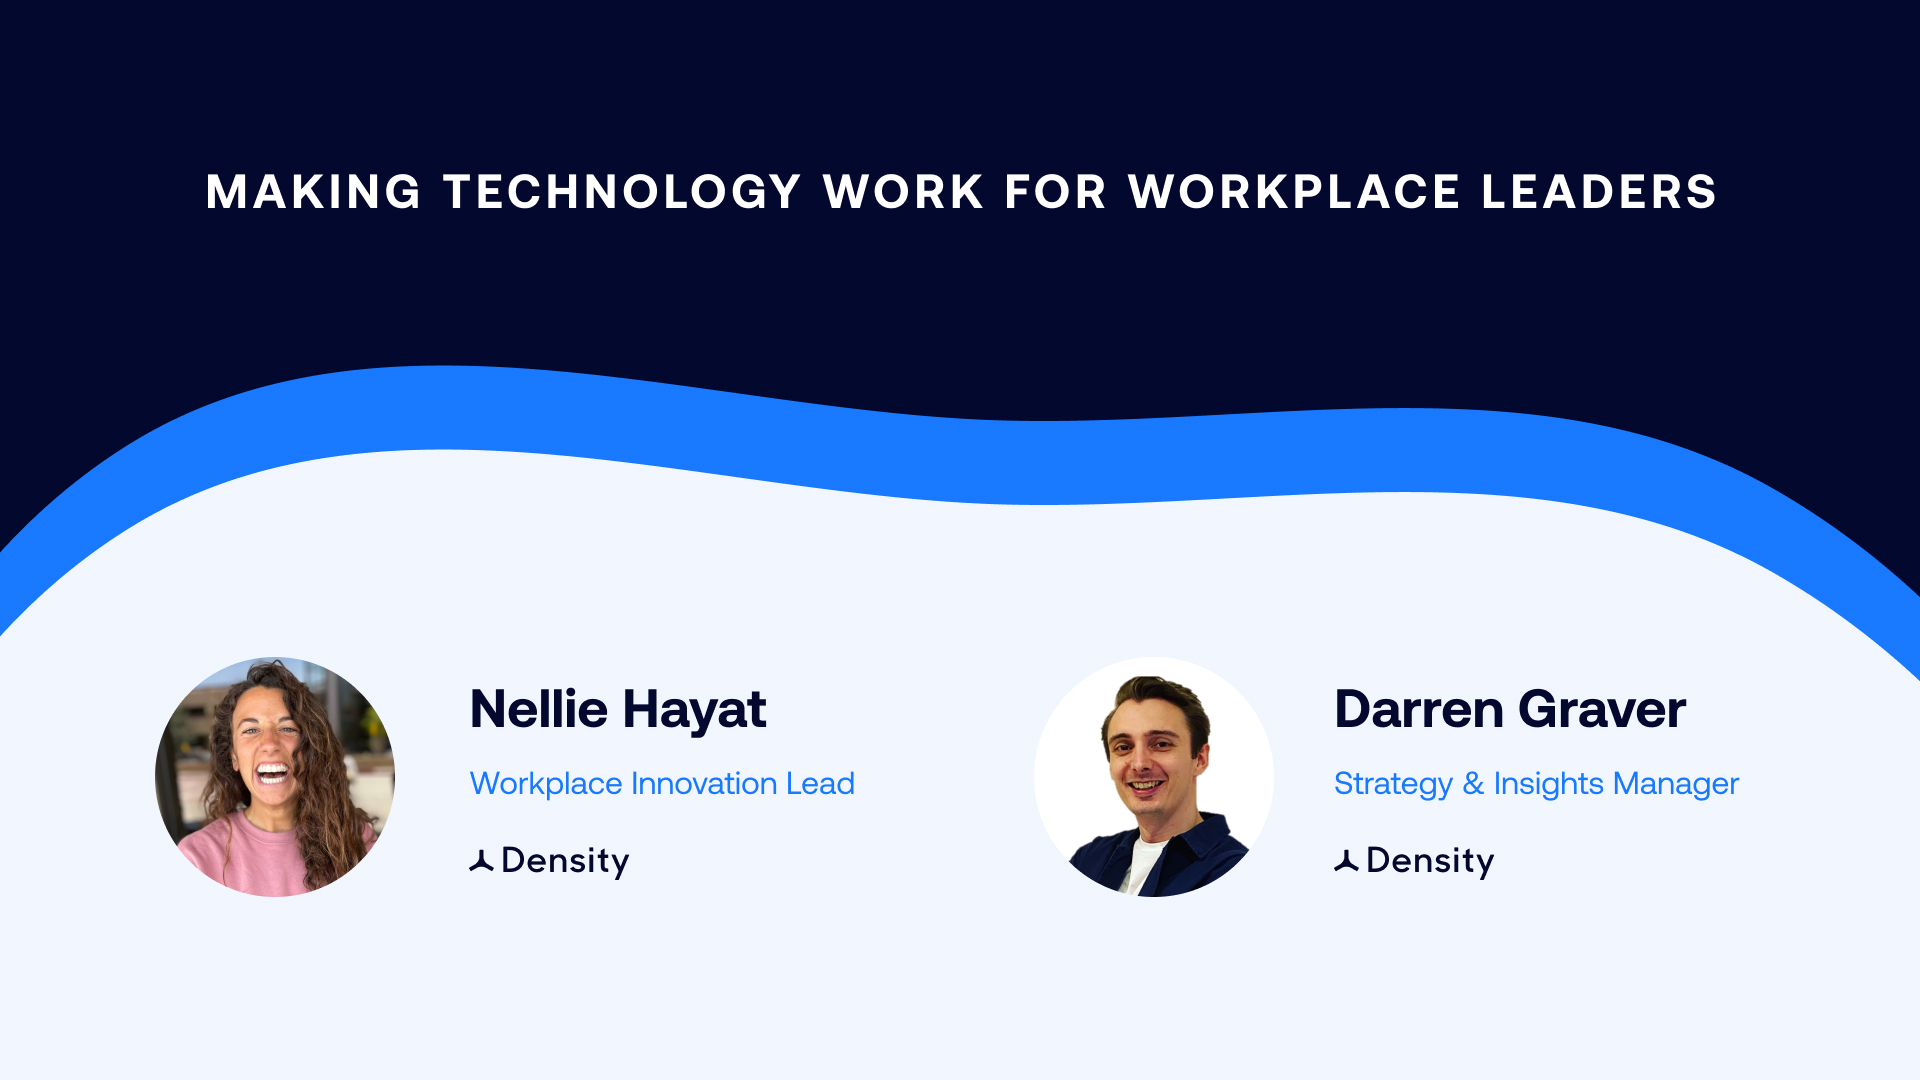
Nellie Hayat and Darren Graver, two of Density workplace experts, held a webinar to talk about how workplace and real estate teams can use technology to design better workplaces. They discussed the impacts of the pandemic, the transformation of the workplace, and the role technology and data play in creating better office environments in the future. Below are highlights from their conversation. Watch the full webinar here.

Key takeaways

  • Workplaces are competing with homes, coworking spaces, coffee shops, and anywhere else employees want to work. To win and get employees back in the office, they have to provide real value to workers.
  • Data and employee feedback are essential to the successful innovation of the workplace. 
  • Companies have to find the right office design strategy for their team rather than looking to industry leaders to follow. 
  • The pandemic made it clear that traditional workplace design wasn’t inclusive. With sensor data, companies can make more informed decisions and create offices that make all employees feel welcome.

The workplace is now a product, and employees are the consumers 

During the initial pandemic lockdowns, workplace professionals worried that the office (and their jobs) might be rendered obsolete. The dust from this upheaval has settled now, and it’s official: The workplace is not dead. 

It’s going through a metamorphosis from a static destination into a dynamic product, and the employee is the customer. Products must cater to their consumers, so the post-pandemic workplace needs to focus on the employee experience. 

Much of the pandemic’s office impact is tied to workers no longer being what Nellie calls a “trapped audience.” In pre-pandemic life, she says, “We didn’t need data because our audience was a trapped audience. They had to be in the office five days a week. Workplace and real estate leaders didn’t need to continue iterating or innovating to attract the audience.” 

Now that employees can work from anywhere, offices have to compete with homes, coffee shops, and coworking spaces. With this new flexibility, “they’ll choose what works best for them,” Nellie says. The key to attracting employees back to the office is “to find out what is so unique and original about our workspaces that those other places cannot offer.” 

Once workplace professionals discover their office’s unique selling points, Nellie says they have to “really revamp towards that direction and continue getting feedback through sensor [data] and through individual feedback. [Workspaces] need to attract people every day, and if they’re not trendy, they’re not sexy, and they’re not bringing value, people will stop showing up.” 

Darren explains, “What we’re really saying, in a nutshell, is that the workplace is now a product.” It has to have features and benefits that appeal to employees and add value to their lives. 

How sensor data supports hybrid work and better offices

A hybrid model is part of delivering a workplace product employees want, but that doesn’t mean the transition will be easy. To ensure the office space is still being used well, a hybrid work model means reconfiguring desks to make way for collaborative and reconfigurable spaces. 

Transitioning from assigned seating to unassigned seating is a “huge cultural change,” Darren says, “and it comes with a lot of negative connotations. People always think, ‘Oh, it’s going to ruin my work experience. It’s going to make my life horrible. I’m not going to want to come into the office.’” 

It’s a change that requires employees to break a habit that’s been formed over many, many years. The key to easing this transition is to “do it in a thoughtful way, and data can really help us articulate that and be transparent with how we go about it,” explains Darren. “You’ve got to work out how you deliver a space that performs and doesn’t give people a negative experience.”

Sensor data can help workplace and real estate teams better understand the type of space employees need. It’s also essential in convincing company leadership to invest in an updated office environment. With the assigned seat model, it was easy to see when another desk or additional square footage was needed.

For example, if a new employee is coming in and there’s no free desk, you know you need to add a desk. If the team is growing and the office feels cramped, you know you need to expand into the next suite. It’s not as simple with hybrid work models and unassigned seating. It requires technology that can provide deep insights into which areas of the office are underutilized or how many people are in the building at any given time.

Nellie explains that workplace designers “have to have data to show conclusively that this or that is needed. Leadership wants to see real evidence before making an investment in the office space.” Sensor data shows that the choices designers make aren’t arbitrary. They’re essential for creating an office employees want to be in. 

“In the future, no leader will be able to say, ‘Oh, I didn’t know that my office experience sucked.’ You have the data. You have to be real and say, ‘Yeah, I know people haven’t been showing up, so I need to do something about it if I want to continue using this space as a tool to create bonding, collaboration, community, and socialization,’” says Nellie.

Using data to design inclusive workplaces

The pandemic has proven that data is key to creating offices that support workers. In the past, workplace data wasn’t seen as essential. Offices were built based on anecdotal evidence such as, “The office wasn’t busy when I was there” or “People don’t like that type of space.” Based on this unreliable word-of-mouth evidence, employers assumed that the workplace was well designed for everyone.

“I think the pandemic has revealed that it was not perfect, and it was not working for everyone,” Nellie says. “For me, it’s been striking to read the [employee] surveys…Minorities are saying, ‘You know, I’d rather not come back because I never felt I could bring my best self.’” 

Part of creating an inclusive work environment includes addressing factors beyond the physical space. You have to factor in data and feedback from the teams that are focused on people. Nellie says, “It’s not surprising to me that people and workplace [teams] are now merging because we do need data from both categories to help design better than ever before.”

In the employee surveys, Nellie also found that women were less willing to come back to the office than men. They felt the space wasn’t designed for them and didn’t “encompass their womanhood.” For example, few offices have lactation rooms where breastfeeding mothers can feel safe and comfortable when they need to pump. 

She continues, “If we want to design for a larger audience — something that is inclusive and diverse — we need data to know what is working and not working.” It’s data, rather than the old method of unreliable anecdotes, that will help workplace professionals design offices that serve everyone. 

“As we move into the future, I think the employee experience comes front and center. I think we transition from this sort of anecdotal feedback to much more of a dynamic feedback loop where technology and data can really help,” Darren says.

Companies have to innovate, not copy

“The pandemic opened new doors for us to reinvent, reimagine,” Nellie says. But reimagining an office space that’s been stagnant for decades is no simple task. Some workplace professionals question if it’s better to let industry giants such as Apple and Google figure out the post-pandemic workplace model and then follow suit. 

For Darren, the answer to this question is an emphatic “no.” “We really have to push past this fear of failure, because the reality is, no one has the answer about what the future looks like,” he says. “We should hypothesize as workplace professionals, and we should test it using data. I think for at least the next 18 to 24 months, we’re going to be in this perpetual beta [test].”

There are several issues with trying to carbon copy another company’s workplace strategy, no matter how innovative and impressive it is. Every company is different. It has a different mission and different employees, so there can’t be a one-size-fits-all approach. 

Darren also believes that the companies that don’t look at the data, listen to their employees, and reimagine the office for themselves will fall far behind their competitors. As they’re busy copying another company, that company is continuing to iterate and create something new and better.

Nellie says, “This is a very new path for us, but we can learn a lot from other industries [such as restaurants and hospitality] that didn’t have a trapped audience. They’ve moved to a system that requires them to look at the data often to stay up with the trends and to continue iterating. It’s challenging, but the silver lining is it’s giving us a breath of fresh air into this industry.”

Hear more of Nellie and Darren’s conversation by watching the full webinar here.

Density Raises $125m Series D Round Led by Kleiner Perkins

November 10, 2021

In 2014, there was a question that inspired us to start Density — Would it be useful to know how a city is used?

We believe the answer is, yes. If New York City all of a sudden knew how it was used, it would identify its inefficiencies and redesign itself. An entire city reliably knowing how it was used would unlock a world of new possibilities.

Whatever is true for New York would be true for San Francisco and Denver and Boston. It would be true for Toronto and Paris. For Berlin and Tokyo. For Cape Town, Delhi, Mexico City, Mumbai. Whatever is true for one major city would be true for every other city in the world. How have we gotten this far without knowing how all this space is used?

The fundamental problem here is not just technology. Building an autonomous system that can make sense of the remarkable complexity of human behavior in buildings is fascinating and very hard — particularly when you value preserving a visitors’ reasonable expectation of privacy — but this city-scale question is not just a technology problem. It’s a distribution problem.

How do you get an intelligent system that understands human behavior into every relevant room in the world? Whichever team can answer that question, earns the right to help remake it.

Historically, we have designed and used buildings based on observation, trends, surveys, and precedent. Buildings are the most valuable assets in the world whose performance we do not measure. And yet their construction and maintenance come at extraordinary cost. Buildings account for 39% of global CO2 emissions. 4.4 billion sqft of U.S. office space is vacant but paid for (pre-pandemic). And how we currently use all this space results in wasted time, bad design, inefficient energy use, underutilization, and incalculable opportunity cost.

We need better tools of measurement because measurement will lead to improvement.

  • We need the ability to navigate 10 million sqft of space as easily as you pinch-to-zoom.
  • To replay how people use space without invading their privacy.
  • To see if a space is available in real-time.
  • To compare the performance of a room or neighborhood or floor or building.
  • To find successful spaces, identify productive behaviors, and see where there is collision, lingering, or focus.
  • We need the ability to A/B test physical space.

We used to want these things. Today, we need them.

Our mission is to measure and improve our footprint on the world. At present, we focus on the workplaces of some of the largest companies in the world – spanning 32 countries with more than 1.25 billion sqft under management. We do this because we can have an immediate and outsized impact at enormous scale but over the next decade our goal is to help reshape cities.

Today, we’re proud to announce a $125 million round led by Kleiner Perkins and the acquisition of HELIX RE. The round values Density at $1.05 billion. With these investments, we plan to build the requisite tools above and solve the distribution problem.

Join us. We’re hiring.

Andrew Farah, Co-founder & CEO

Returning to campus after COVID-19

COVID-19 has highlighted the delicate balance between protecting student health through remote learning and providing an effective curriculum in a virtual classroom. Internet connectivity issues, constant distractions, and a lack of direct supervision can all hinder a student’s ability to succeed. As such, teachers and students (and parents) are particularly keen on returning to campus and getting back to work.

But in order to do this, there are a slew of safety issues that need to be addressed before schools can ensure the continued health and well-being of students and faculty. Capacity requirements, cleaning schedules, and university-family relations are all key considerations that institutions have to define before bringing students back.

Safe by Density provides schools with the real-time data they need to protect their community. Displays, Alerts, and public web-links offer students and faculty the ability to choose when to visit busy areas like cafeterias, libraries, and bookstores. Safe Analytics enables staff to streamline cleaning services based on actual usage. These metrics help schools maintain social distancing on campus, avoid exceeding capacity limits in high-density areas, and reassure families that all safety precautions are being taken to keep their students healthy.

Hotspot monitoring

High-density areas such as cafeterias, libraries, and gyms present a much higher risk for viral transmission because of constant student foot traffic. By utilizing Safe by Density, university staff and students can monitor the number of individuals in each of these ‘hotspots.’ Students can rely on accurate, real-time occupancy metrics to avoid crowded areas and navigate campus safely.

For example, many universities have two or more cafeterias in order to provide efficient meal-access for students on different sides of campus. Safe by Density allows those schools to set capacity limits on each cafeteria and disseminate that information to students. Then, students can decide which cafeteria is less crowded before they leave their dorm or study space, thereby saving time avoiding long lines and keeping themselves away from large groups where COVID-19 will have a better opportunity to spread between people.

“My friends and I have talked about how crowded [the cafeteria] gets right after class. I spend so much time just waiting to get in, I could be more productive during that time.” – Danielle Galvao, Computer Science major at Notre Dame

Usage-based cleaning

The majority of universities subscribe to hourly or timed cleaning schedules. While these can be effective in predicting when large rushes of students visit certain facilities, like cafeterias or study halls, there are many circumstances on campus when those schedules are too rigid to provide adequate cleaning services in changing environments that need immediate attention. Increased sanitation efforts will put a strain on maintenance and cleaning crews if they’re left to guess which buildings on campus need the most attention and how often.

Safe by Density equips custodians and cleaning staff with the tools to track and analyze the actual usage of school facilities. Being able to accurately monitor when a high volume of students visit certain facilities enables custodians to streamline staffing schedules and avoid cleaning areas that have been unused. A university’s custodial resources are crucial to the continued health and wellness of students and faculty, and this data helps them organize their efforts more effectively.

University-family relations

When it comes to schools reopening campuses, families are naturally (and rightfully) concerned about their student’s health and safety. It’s important to recognize that because campuses are central locations hosting thousands of people from all over the world, they inherently present an elevated risk of viral transmission. As such, many families are reluctant to send their children back to school, especially if the university isn’t implementing every possible precaution to navigate the risk. By integrating Safe by Density with university student portals, both parents and students can monitor the capacity of busy areas. This enables students to make informed decisions about where to spend their time, and it provides parents the opportunity to check on how the school is keeping up with the busyness of a new semester.

As a college student myself, having a system like Safe by Density implemented at school would give me peace of mind. It would show that my university is taking the necessary precautions to offer the college experience I deserve, while still ensuring that I have the tools to safely navigate my campus. Knowing that public spaces are being consistently monitored and sanitized would help me feel more comfortable visiting my whole campus and not just hiding out in my dorm and in the quad. We’re not sure what “normal” will look like after COVID, but systems like Safe by Density can grant students the opportunity to get back to school and focus on what we’re there to do: learn. 

6 ways real-time data will change the campus experience

The University of Notre Dame takes campus experience very seriously. In recent years, they’ve revamped their student center to feature a three-story rock climbing wall, an elevated indoor track around the perimeter, a stage for campus performances, and a full size coffee bar that would make most Starbucks locations look like food trucks. And that is just 1 of the 170 buildings on campus.

The school is a modern beauty. And notably impressive for a university that just passed 177-years-old.

Paul Turner, Director of Learning Platforms at Notre Dame, shows Ari Kepnes, Director of Market Research at Density, around Notre Dame’s campus.

Notre Dame stays nimble because they constantly seek feedback from students and faculty members about everything from physical space to new tech. Often when we discuss new technology in academia, we talk about AI, VR, 3D printers, and robotics. Notre Dame is certainly no exception. Students there have access to multimedia labs and cutting-edge learning platforms.

However, seemingly simple problems can become lost in the electric sea of innovation. For example, the same students building virtual worlds in the new media lab still have to guess as to whether or not the library is too busy to go study there. A student’s progress in a design space could be halted by a long dinner line at the dining hall. Before they installed Density, there was no practical solution to cross-campus occupancy analytics.

Hearing how Notre Dame is using Density data to improve student life has us considering 5 ways real-time data will change the campus experience.

1. Campus dining

The students we spoke to at Notre Dame all expressed irritation with waiting in long lines at the dining hall. “It’s so annoying” is a phrase we heard over and over. Since college campuses are generally pretty large areas of land, walking across them can take some time, especially in inclement weather at schools like Notre Dame. A student walking from the library on one side of campus to the dining hall on the other may have already spent 15 minutes en route. Adding a 20-minute line at a stir fry bar or for pizza can, well, eat into their motivation to navigate the campus. Instead, students may opt to skip meals in favor of a Cliff Bar or vending machine item. If universities can provide real-time occupancy analytics to students via campus mobile applications, students can better predict the busyness of the dining hall and avoid those unnecessary and demotivating trips to a crowded cafeteria.

Installation of Density at Notre Dame campus

2. Libraries & study areas

Another pain point that Notre Dame students expressed is how frustrating it is to go to the library when all the desks and chairs are already taken. Failing to find a spot to study on a college campus should be a thing of the past.

With Density’s real-time occupancy data, students can know ahead of time which floors are more crowded, so they can avoid the hassle of wandering around looking for a place to study. Danielle Galvao, a computer science major at Notre Dame, told us about how her friends will often “leave their stuff” in one building and go look for an open space at the library, then claim that open space somehow, only to walk back to retrieve their stuff and turn around again. This is a terribly inefficient way to navigate space and can act as a huge waste of time for students who simply want to study.

3. Physical security & tailgating

Campus security is paramount. Knowing that the people who enter a campus building are people who are actually supposed to be there is a huge undertaking. Students use their school ID cards to scan into dining halls, libraries, and dormitories. However, other than a security guard meticulously watching each entry, it’s hard to stop additional students or other people from “hopping a turnstile” or sneaking in passed the entry undetected.

Real-time occupancy analytics (specifically from Density’s DPU) can stop this unwanted activity altogether. When paired with ID scanners, Density can detect people who haven’t properly badged in and trigger an appropriate security measure; it can set off an alarm, alert a nearby guard, take a picture on a security camera, lock a secondary door, or any other option installed by the campus security director. Using this process, college campuses could reassure students and faculty members that they are safe where they study.

4. Games & events

The benefits of real-time occupancy data are many at college concerts. From an attendee perspective, knowing which snack bars, beer lines, and bathrooms are open can dramatically cut down on time spent not watching the game or show. You shouldn’t have to miss a big play or your favorite song just to wait in a line for a snack. Attending a big event on campus could be a much better experience if you could check occupancy data on your phone prior to leaving your seat.

5. Facilities management

Speaking of big events, concerts and games are a huge undertaking for facilities managers. Real-time occupancy analytics could drastically change the efficiency of their work. If an FM can apply Density’s predictive occupancy analytics to their sporting events and concerts, they can budget better. They can prevent food waste. They can track the exact sections of the stadium in which certain foods are selling better than others, which might lead them to redraw the vendor map entirely. Food trucks and parlor games could be strategically placed in locations most likely to drive traffic and revenue. During a game, those facilities managers could keep an eye on which bathrooms or trash cans have been most heavily used, giving them the opportunity to clean them more immediately and provide a more enjoyable experience for attendees. Real-time data improves both the management and attendee experience while simultaneously saving money and time.

6. Space planning

Space planning is critical for all college campuses. Although I have focused on our Notre Dame case-study, Density also partners with New York University’s workplace team to help them justify real estate expenses. NYU happens to be one of the largest real estate owners in New York City. With such a large portfolio and limited land in which to expand, NYU has to be incredibly diligent with their real estate investments. Do they need another library building? How is the current student lounge being used? Density allows them to measure foot traffic in real-time (and historically) and then mathematically confirm that they’re spending wisely.

For all the reasons listed above, being able to accurately measure real-time occupancy will completely revamp the college campus experience. This data matters to managers, board members, teachers, and, most importantly, students. With hundreds of millions invested on campuses every year, schools should know how their buildings are used.

Watch the video recap of our time at Notre Dame: